What is wrong in this Smith chart?
时间:04-04
整理:3721RD
点击:
Hi,
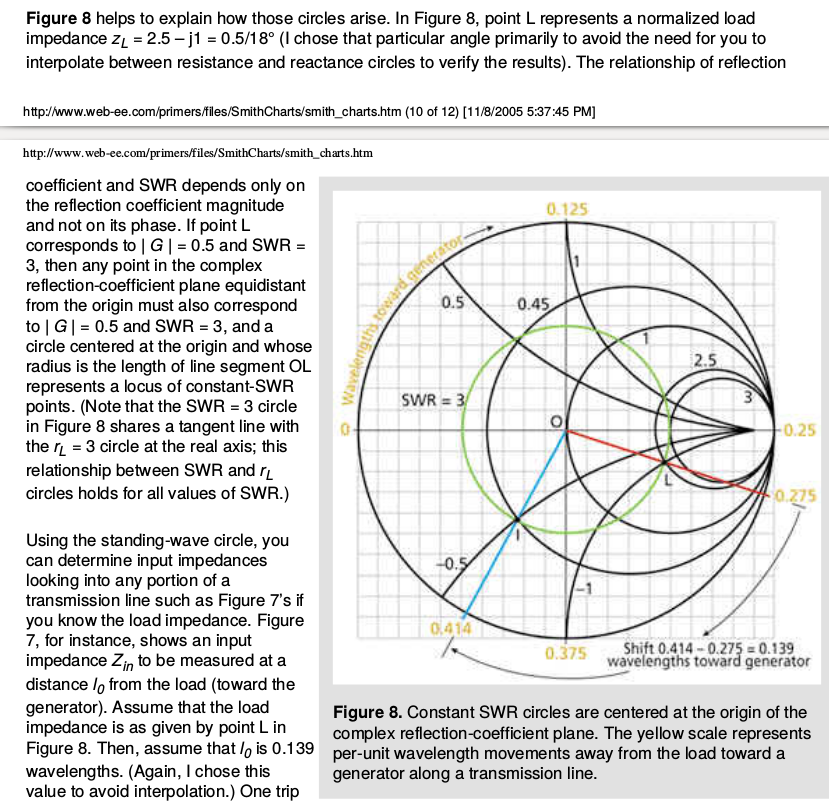
I learn Smith chart from this tutorial, but I find its description is different from its figure.
First of all, I cannot get the normalized impedance (0.5, 18 degree). At least the angle should be a negative value.
z_L = 2.5 ? j1 = 0.5/18°
Could you help me on the understanding?
Thanks,
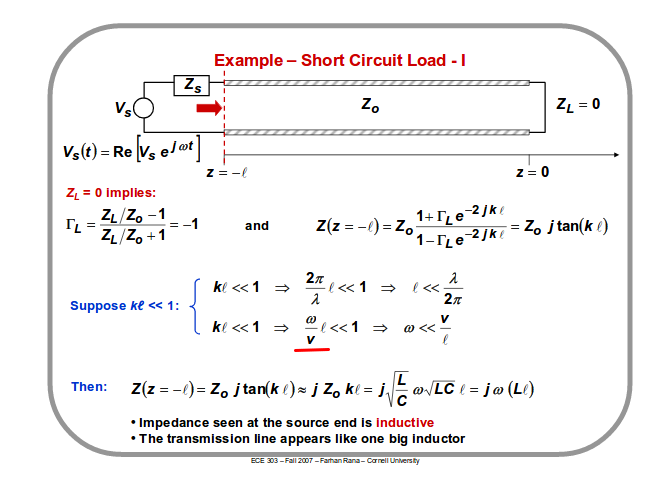
Excuse me. I know now it is about transmission line. A new question is here. What is 'v' in below picture (I put a red line below ''v"). I don't find an explanation about it on the slide file. Could you explain it to me?
I learn Smith chart from this tutorial, but I find its description is different from its figure.
First of all, I cannot get the normalized impedance (0.5, 18 degree). At least the angle should be a negative value.
z_L = 2.5 ? j1 = 0.5/18°
Could you help me on the understanding?
Thanks,

Look here where the angle starts (0°) and what direction it turns:
http://www.excelhero.com/blog/images...elhero.com.png
Sorry, I am confused now with 0.5/18°. What does 0.5/18° mean in below? How is it obtained? Can I calculate it from 2.5-j1?
If it is zL's reflection coefficient, the angle should be -18°. Am I right?
point L represents a normalized load
impedance z L = 2.5 ? j1 = 0.5/18°
Thanks,
Hello,
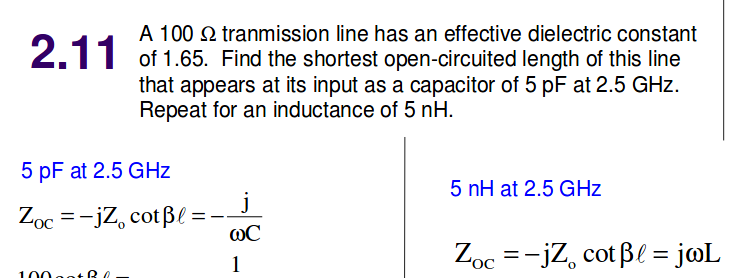
I read below equation on a slide. I am new to this topic and would like to learn about it. Could you tell me the name and what tutorial could talk about it on line?
Thanks,

Excuse me. I know now it is about transmission line. A new question is here. What is 'v' in below picture (I put a red line below ''v"). I don't find an explanation about it on the slide file. Could you explain it to me?

"v" means speed of light.3*10exp9 m/sec
