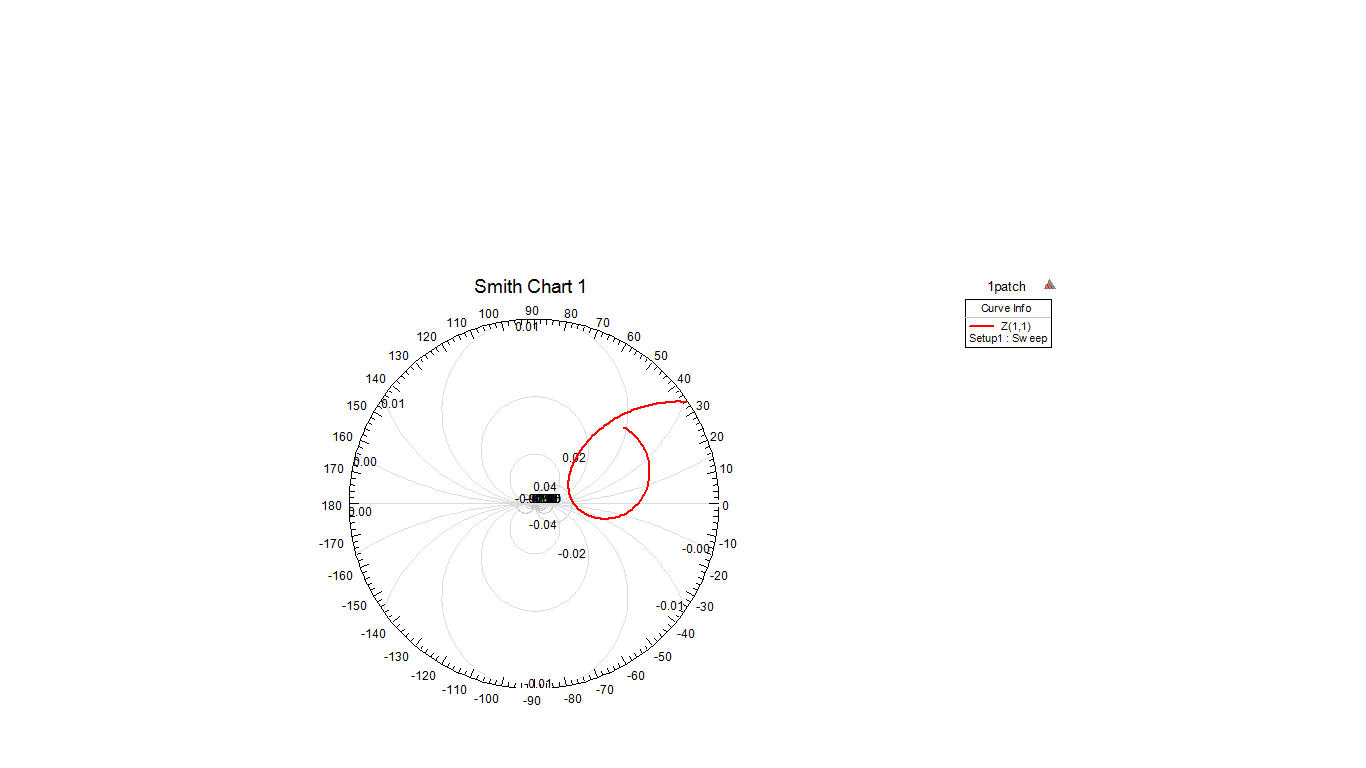
Strange HFSS impedance smith chart
Plot S11 on a rectangular graph and you may get the answer.
Thanks, but I plot |s11| in dB and it is lower than 0 on the whole frequency band, I don't think it is |s11| that causes the problem, also all the projects that work well show the same problem, it maybe impossible they all go wrong...
Why do you think the impedance plot is strange? |S11| > 1 would refer to negative real impedance, it's obviously not the case here, impedance locus stays in right half plane.
But I hope to return to normal smith chart format...I don't know why the chart appears like that
Use S11 for the chart, not Z11
So s11 is complete same as Zin for single port network...thanks very much
No, S11 is S-parameters and not impedance. Smith chart usually expects S-parameters (not impedance) for input data.
OK, thanks