plots of transconductance Vs Impedence in cadence Spectre
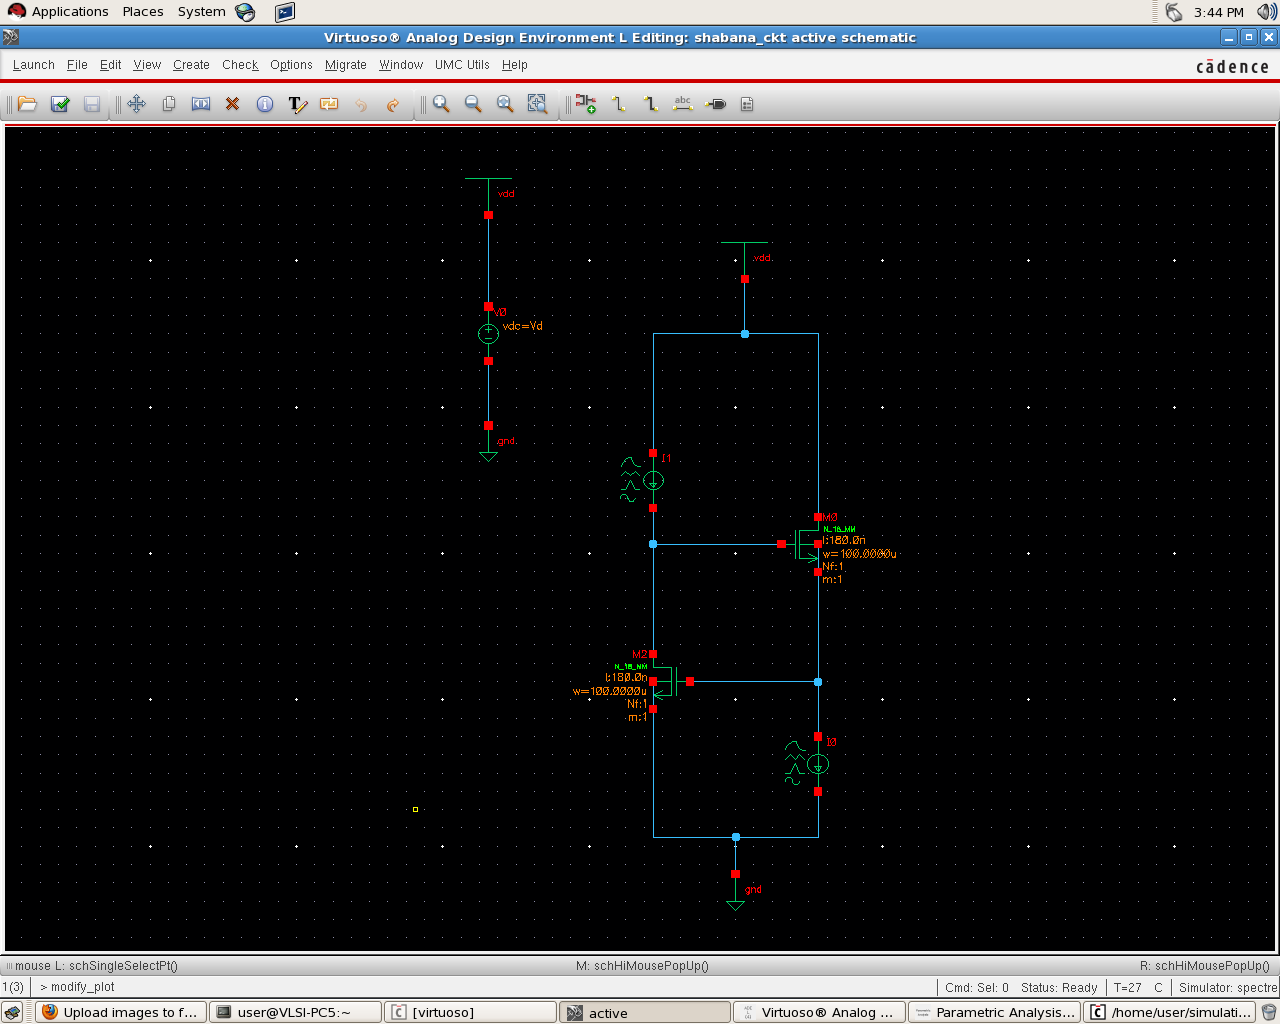
I have an active inductor. It is required to plot the graph between Transconductance (gm) varying on the horizantal axis and the impedence (Seen from the source of M0).
Attached is the schematic of the circuit.
Request you to please help me out.
Thanks in advance.
Hello)
Just plot both of them, then in waveform window go to Axis ->X axis ->Plot vs. ... and change independent variable to impedance plot.
Suppose this is what you want.
Hi,
This is the way how I have proceeded:
1. Launch ADE L
2. Click Analyses -> Choose "dc" -> Select "set dc operating point"
3. Click Variables -> Copy from Cellview
4. Click Tools -> Parametric Analysis
When parametric analysis window is opened, the variables you chose to plot and which you have selected by means of "Copy from cell view" is automatically loaded.
5. Give the sweep range in accordance to your requirements.
6. Click Output in ADE window.
7. Open calculator and type the required function.
8. Click on "Get Expression" of pop-up of "Output" of ADE window. Then "add" the expression
9. Click on Run of Parametric analysis window.
10. The required plot is then plotted.
I have typed the impedence function in the calculator window and plotted the graph of voltage Vs impedence (by varying voltage, observed how impedence changes) from parametric analysis window.
Then I opened Results Browser from Tools menu, clicked on dcOpinfo-info, selected the required variable (gm in my case) and then upon rightclicking on the variable,selected append. So, I have plotted the graph between impedence Vs Voltage and gm Vs voltage.
But I need to plot impedence Vs gm.
In the waveform window, in the trace menu, "select all" option is present. I did "Select All" so that all traces in the plot are selected. Go to Trace menu -> Save. A pop-up window has opened asking for path to save in .csv or .vcsv format.
Here my query lies:
When I mention the path and click save in .csv format, I don't find the file in the mentioned path. I tried to save in multiple paths but I don't find the file after saving. Please let me know what is the issue.
Had I done anything wrong in the above steps? Pls correct me.
Thanks
Now that you have those two plots,put them in one waveform window and change the X-axis as pavel_adameyko told you.
Are you sure that the path you give is the one you check after the procedure?
If yes,check the CIW window to see if there is any error and the process isn't finalized properly.
transconductance plots Impedence 相关文章:
- Advantage of using low noise transconductance amplifiers for RF receiver front end
- Comparison of two antenna polar plots
- vertical and horizontal gain plots
- Matlab Far Field Plots
- How To Change X-axis In Plots of Advanced Design System (ADS)?
- why my sp analysis always plots the same S11 and S21 curve for me?