How To Change X-axis In Plots of Advanced Design System (ADS)?
时间:04-06
整理:3721RD
点击:
Hello. I'm new in using ADS software. I just finished designing a Villard rectifier and wish to observe the effect of input power (from source) to the output voltage. However, I can only view the result based on the frequency only (at the X-axis). How can I change it to input power?
If need to use parameter sweep, can anyone guide me to set the parameter sweep? I am using ADS 2011.
Your help is much appreciated. Thank you
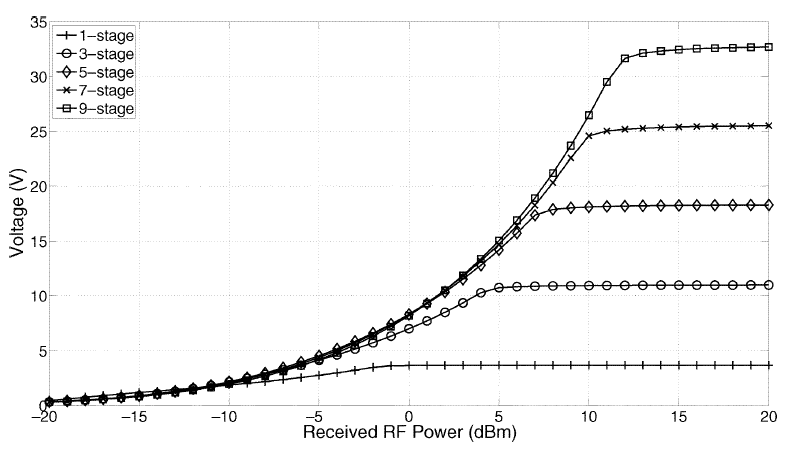
And I would like to observe a graph plot like this;
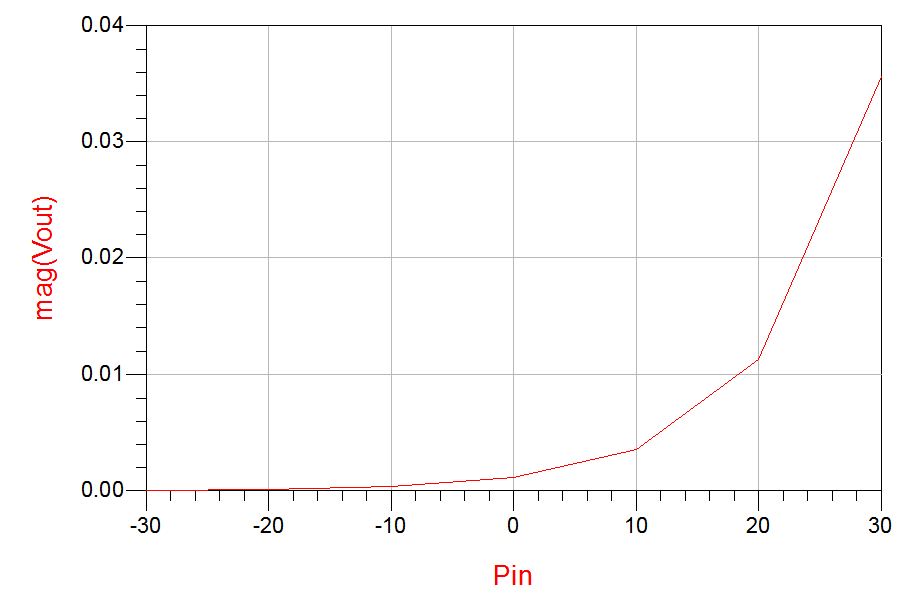
I managed to have the plot like above but I'm unsure whether the input power (Pin) is correct or not since there is no label of unit (dBm) here;
Can anyone help me here..?
P/s: Is the mag(Vout) means that that value shown in the graph is the real value? No need any conversion?
Thank you in advance..
If need to use parameter sweep, can anyone guide me to set the parameter sweep? I am using ADS 2011.
Your help is much appreciated. Thank you
you must just name a line in input and aline in output(like "in" and " out")search in this site for how to name a line
then in result page click on in then "add vs" then click on out and you can see the result you want
This is my circuit...

And I would like to observe a graph plot like this;
I managed to have the plot like above but I'm unsure whether the input power (Pin) is correct or not since there is no label of unit (dBm) here;
Can anyone help me here..?
P/s: Is the mag(Vout) means that that value shown in the graph is the real value? No need any conversion?
Thank you in advance..
Hi,
Do you want to sweep power input and want to multi voltages. on few mouth ago, i see the paper of the IEEE for rectana is used option various power input.
yup. i need something like that. but i need to know the method to do the analysis. I doubted my result because it seems like the diode from my circuit doesnt have the saturation point (where the output voltage/current/power has reach the limit)