Can you explain this reflection figure to me?
时间:04-05
整理:3721RD
点击:
Hi,
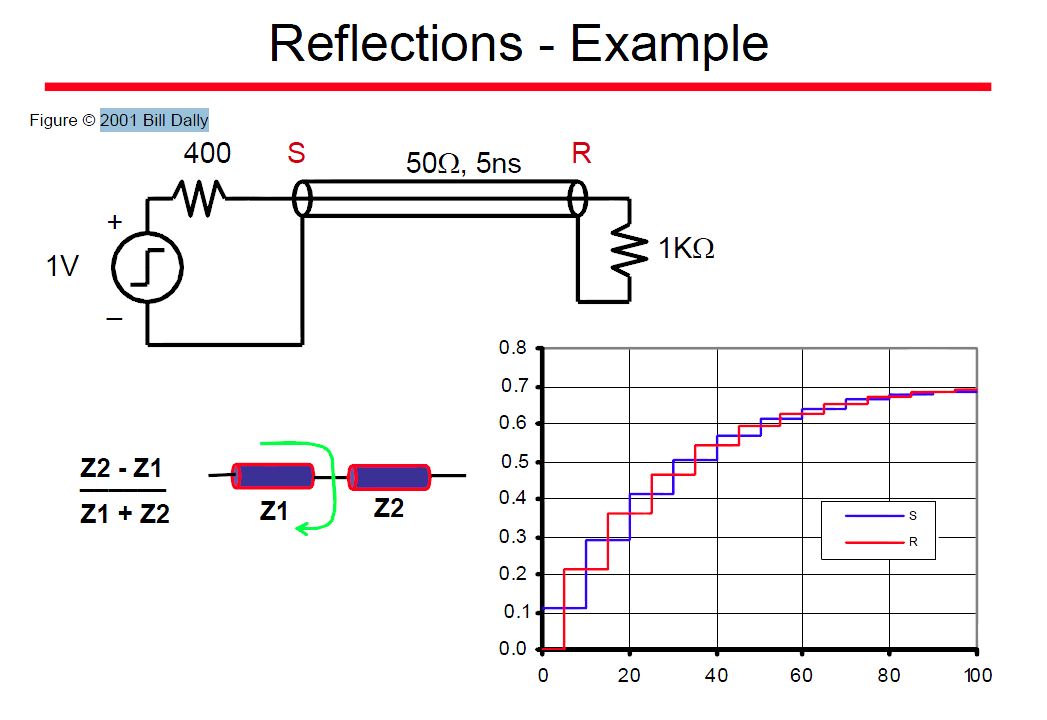
I see several on line tutorials on reflection (transmission line), which was originated from Bill Dally 2001. But I cannot find the original paper yet. I still cannot understand the two axis units of the step like curve. Two files used the same figure including S, R curve, see below please.
One tutorial gave KrS=0.778 which is on this figure, but KrR=0.905, which is beyond this figure range.
Could you explain it to me? Thanks,
The plot shows the step response (voltage) at points S and R. Vertical axis is voltage, horizontal is time.
maybe helping:
http://bwrcs.eecs.berkeley.edu/Class...imization2.pdf
in the steady state, you just have a voltage divider, so the end voltage is 1V * (1K/(1K + 400))
In the interim, you have a number of voltages bouncing around. Its a 50 ohm transmission like, so there is big reflection at the 1K ternmination, and a smaller reflection for any bounce back at the 400 ohm source. Ignore the red curve, concentrate on the blue curve and it will make more sense. round trip time on the line is 10 nS