CST Curve results problem(Parameter sweep & Direct solve
时间:03-31
整理:3721RD
点击:
Hi everybody,
I'm now trying to simulate the phase of the single element for reflectarray.
My problem is with the same model i getting two different phase curve, one phase curve is generated from direct solving of transient time solver (just click "start" to simulate), and the second phase curve is generated by using the parameter sweep by sweeping one parameter. For S curve both technique giving the same s curve.
The two phase curve having some similarity that similar in the part from 9.3GHz to 11.5GHz, but i'm confusing why there are some part are different. Anybody can give me some suggestion?
The results is attached:
Phase curve from direct solving, arg(s)
Phase curve from parameter sweep, arg(s11)
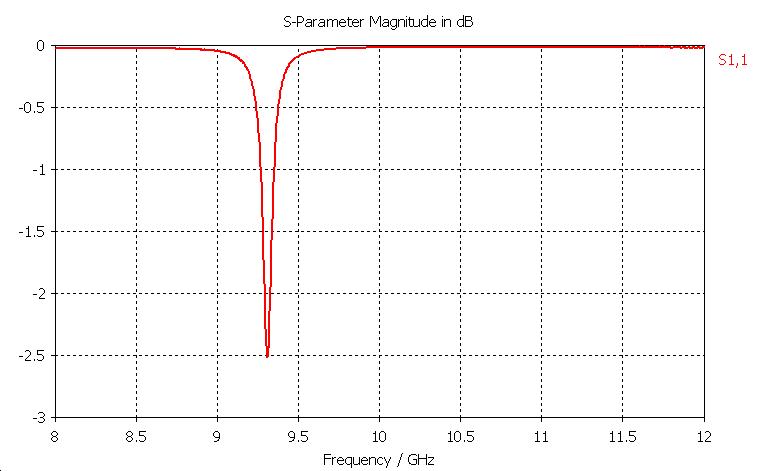
The s curve for the single element
Actually what is the difference between arg(s) and arg(s11)?
This look like may giving different phase results.
Any suggestion will be appreciate.
Thanks in advance.:D
I'm now trying to simulate the phase of the single element for reflectarray.
My problem is with the same model i getting two different phase curve, one phase curve is generated from direct solving of transient time solver (just click "start" to simulate), and the second phase curve is generated by using the parameter sweep by sweeping one parameter. For S curve both technique giving the same s curve.
The two phase curve having some similarity that similar in the part from 9.3GHz to 11.5GHz, but i'm confusing why there are some part are different. Anybody can give me some suggestion?
The results is attached:
Phase curve from direct solving, arg(s)

Phase curve from parameter sweep, arg(s11)

The s curve for the single element

Actually what is the difference between arg(s) and arg(s11)?
This look like may giving different phase results.
Any suggestion will be appreciate.
Thanks in advance.:D
Just found out that actually the two curve are exactly the same except the first curve is plot by force the range to within +180 to -180, and the second curve not. Use the wrap function in plot properties will give the same curve.
- Problem with simulation results of coil design in HFSS
- unsual results when I increase the length of CPW in IE3D
- Help!! why my HFSS results is unreal !
- How results are shifted in HFSS for short Backfire Antenna
- Inductance from 2D/3D results in CST MWS
- help! about results of Allen Taflove's 3D UPML matlab code
