import AutoCAD file to CST MWS
I want to design circular spiral antenna. To design this, my supervisor told to use AutoCAD then I can import it from AutoCAD. Any one know how to design spiral shape in AutoCAD and how can i import that file to CST.
Thank you
You can draw 3-D spiral in AutoCAD by using built-in VBA-based scripting language. After that You can export Your drawing into ACIS SAT file and import it to CST MWS. But much more simple to draw spiral directly in CST MWS - in this case You can make parametric model and can easily change the spiral size, number of turnes etc.
Regards,
Kit-the-great
Hi Kit-the-great
Thank you. I am going to try using your method
Regards
kaandee
Added after 4 hours 31 minutes:
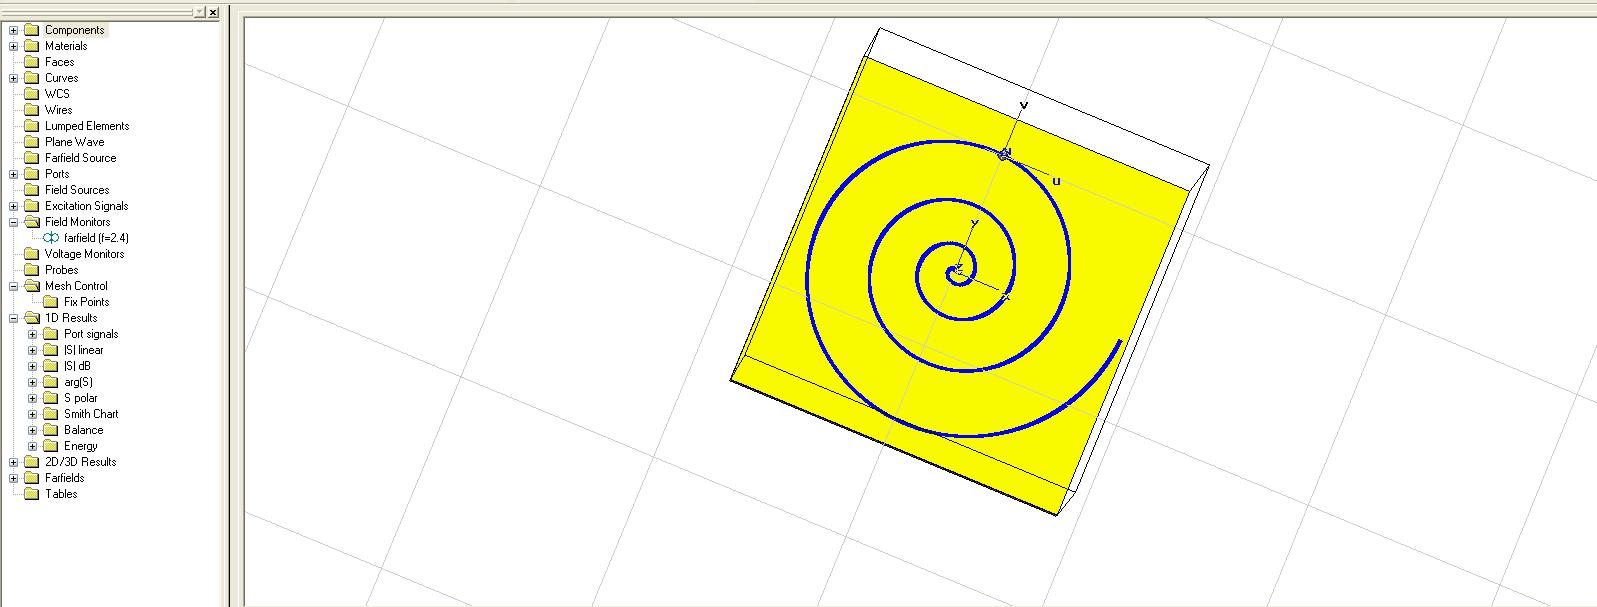
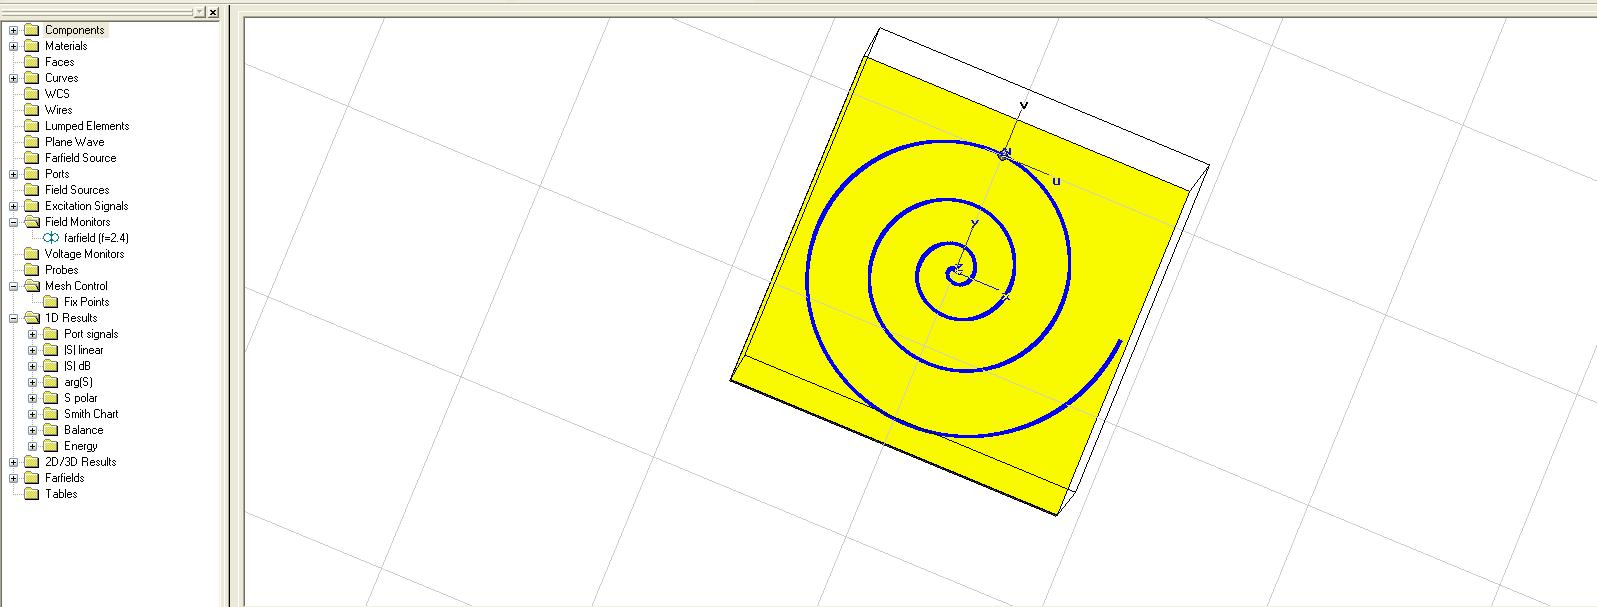
I have imported spiral.dxf to CST MWS. Now How can i use it as component?
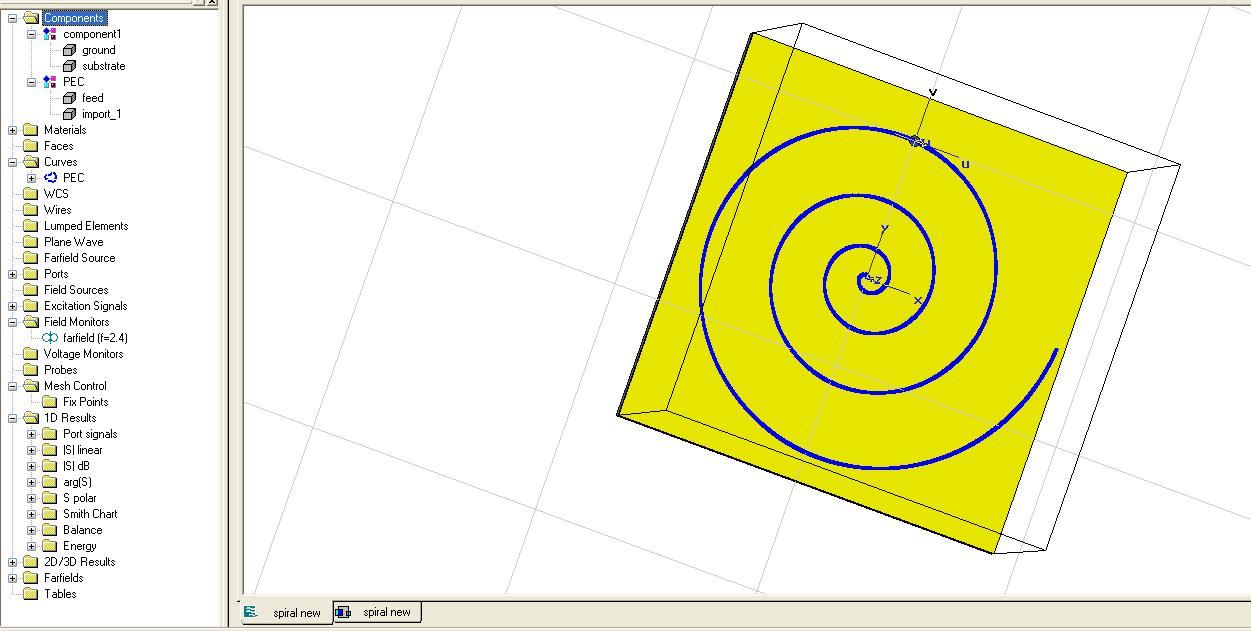
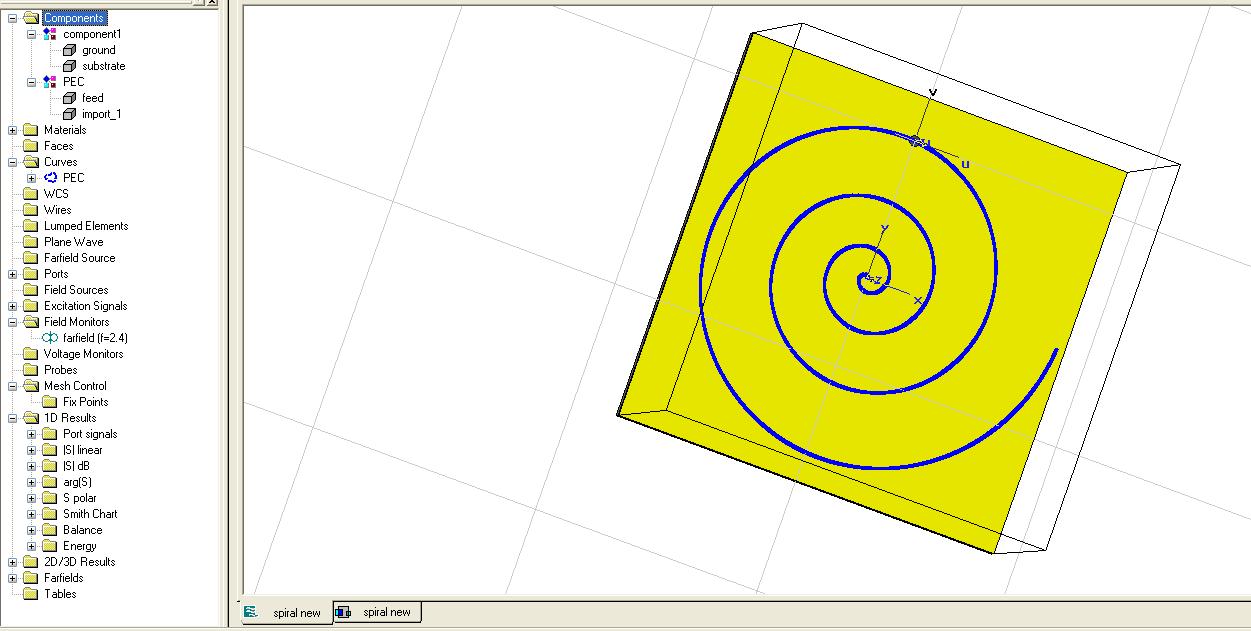
I have design the substrate and ground. but i don't know how can i add it as components folder in Navigation tree?
plz help me
If You want to import Your object from dxf, You can use two ways:
1. Import 2D closed polyline as 3D-object (File/Import/DXF). During importing You should apply material, elevation and thikness for extruding polyline, after that You have 3D object in components tree.
2. Import 2D opened polyline as Curve object. Check the necessary options in import dialog (uncheck 'Close opened...' and check 'Import as curve'). After that You can create 3D object from imported curve immediately in CST by extruding, lofting etc.
If You want to import 3D objects from AutoCAD, You should export it (not 'Save As'!) to SAT file. CST use DXF format to import/export only 2D objects.
Hi Kit-the-cat
Thanks for reply
I have tried as you told.
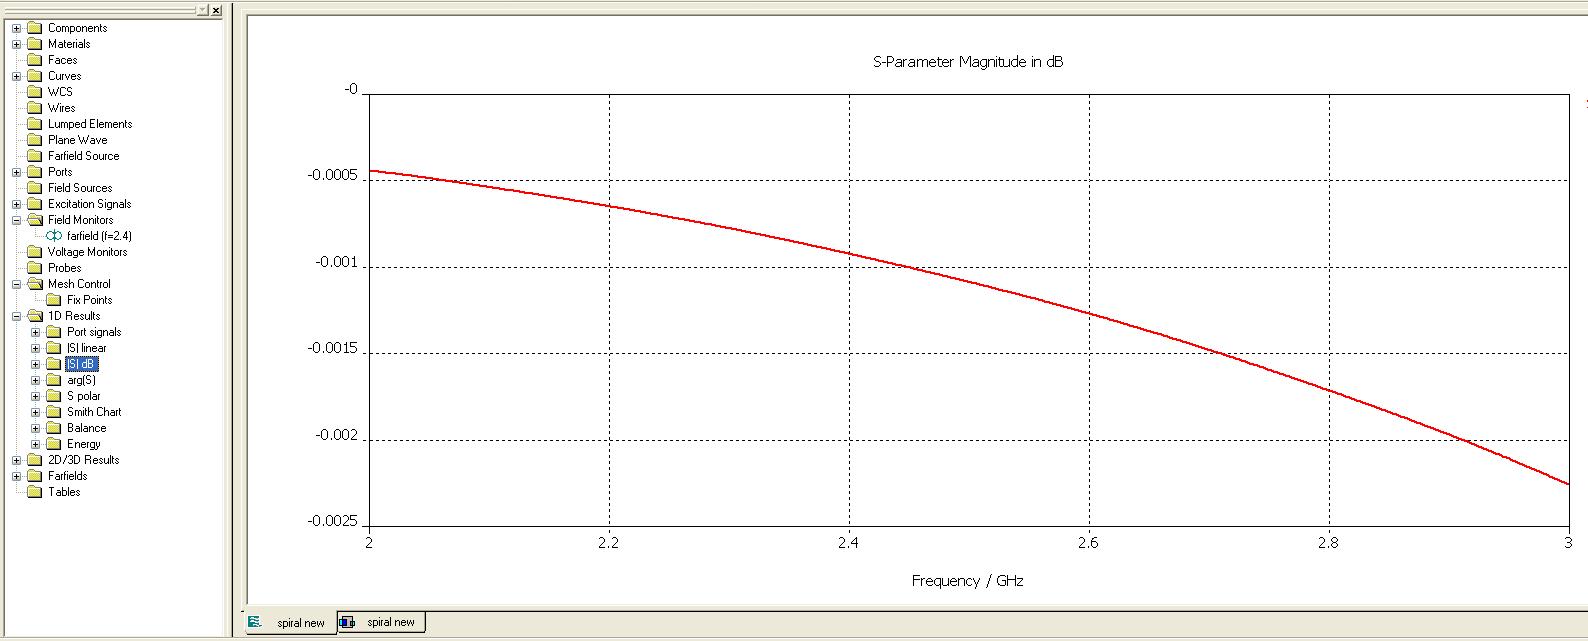
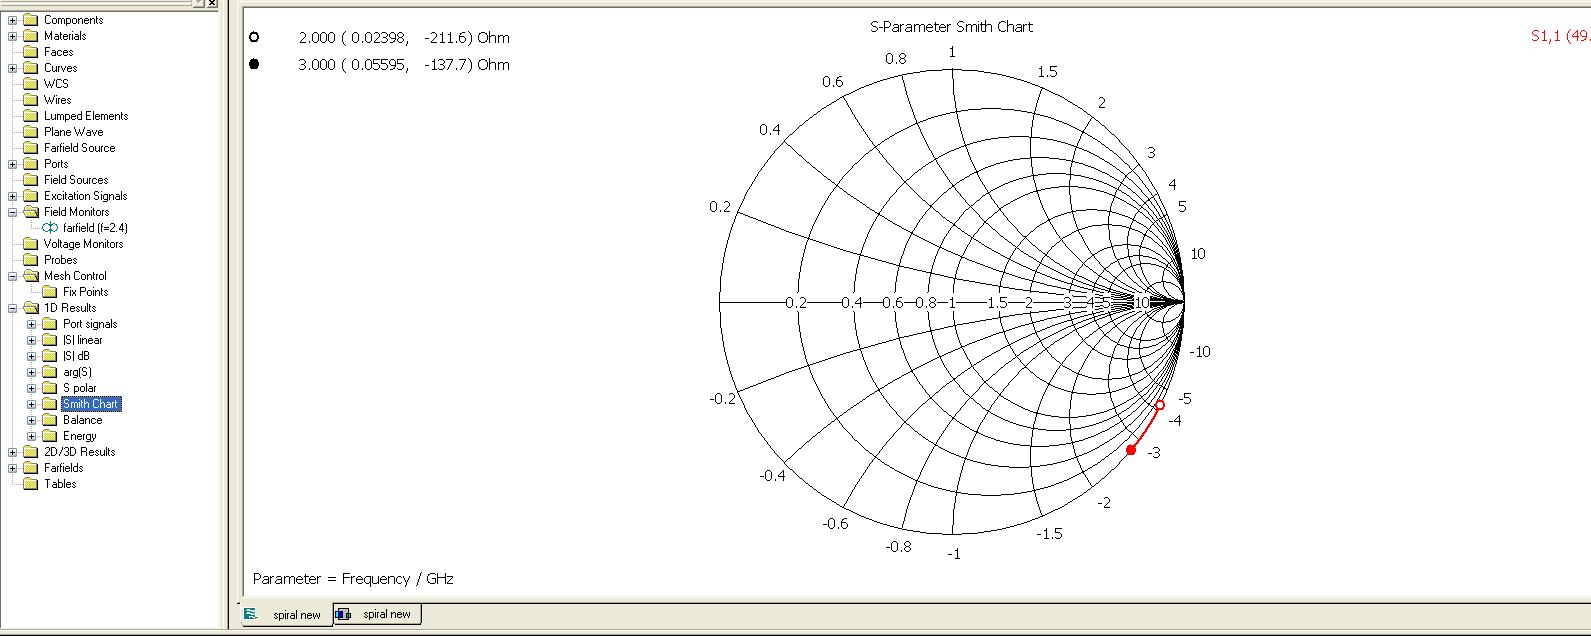
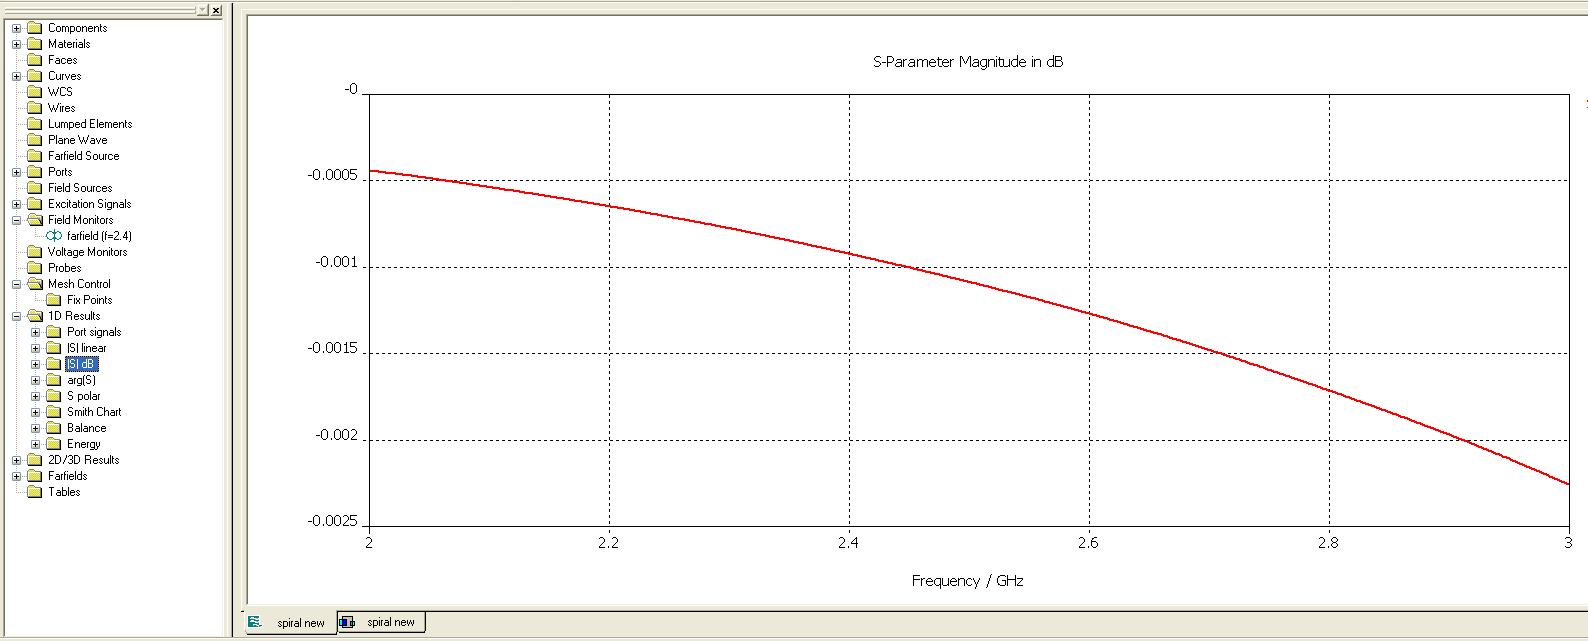
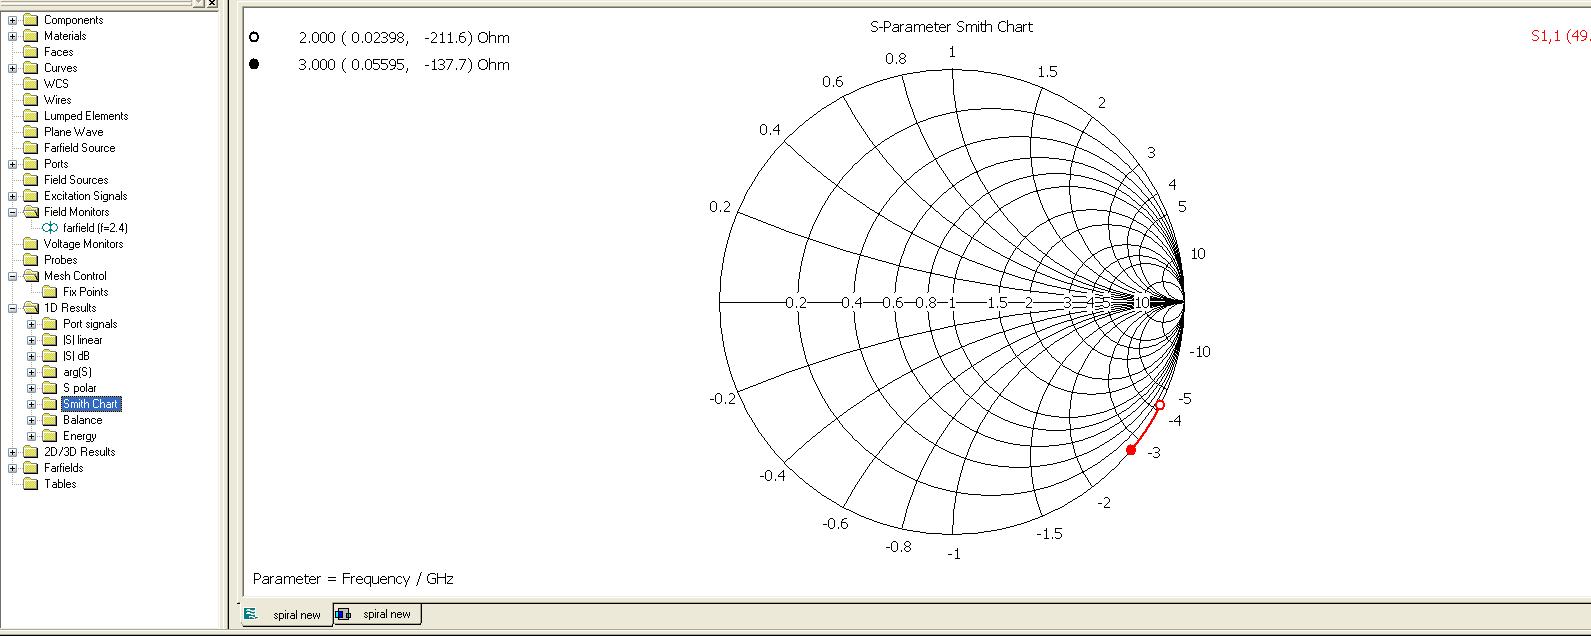
After the trasient solver, S parameter VS frequency graph , smith chart VS frequency grapg is not like proper one
I have attached my result .
plz help me
thank you
kaandee

Added after 4 minutes:
Hi kit-the-cat
thanks. I have tried as you told.
But result for S parameter and smith chart graph is different.
I have attached my result here. what is the reason for this out put
plz help me
thank you
