How to correctly simulate the conductor loss of a very thin line
Another question is related to the line dimensions. The conductor cross section is about 5umX20um. Since it's comparable to skin depth of copper at my simulation frequency, should I apply any special mesh operations or something else besides setting "solve inside" options for the conductors?
Thanks in advance.
What simulator are you using ? Whats your skin depth ? What kind of model do you use ?
Sorry I forgot to mention those. I am using HFSS. The skin depth of copper at 10G is around 0.63um. I swept the frequency from 0.1G to 20G, and that's why I said the skin depth was comparable to line dimensions (5umX20um).
I think you are still in a region where your simple extrapolation model might not 100% be valid. Try your extrapolation trick on higher frequenties ?
If your conductors dimensions are on the order of the skin depth, you should see a transition from low frequency behaviour (DC resistance) to skin effect behaviour at very high frequency.
Thank you guys for your hints.
I now extend the frequency range to 40G. Still, I would say the trend looks not right.
Previously I set the sweep type to interpolation. But later I found it sometimes gives me very strange result (for example, non-monotonic behavior). So now I change the type to discrete. Are there any guidelines as to when to use which? I checked the help, but didn't get it. If I want to simulate from 0.1G to 100G, which shall I use? Or do I have to break the range to a few?
Another thing I noticed is still the initial drop at low frequencies. I have been reading Howard Johnson's black magic book, and it talked about the transition from the RC region to the LC region. However, in both regions the rate should follow sqrt(freq). Yet in my simulation results, I didn't see such behavior in the dB-log plot. I am running more simulation to see if what I see is the transition region between the RC and LC regions.
No. The line has some resistance at DC, which can be quite significant. The sqrt(freq) depence would mean that your line is lossless at DC.
[IMG]
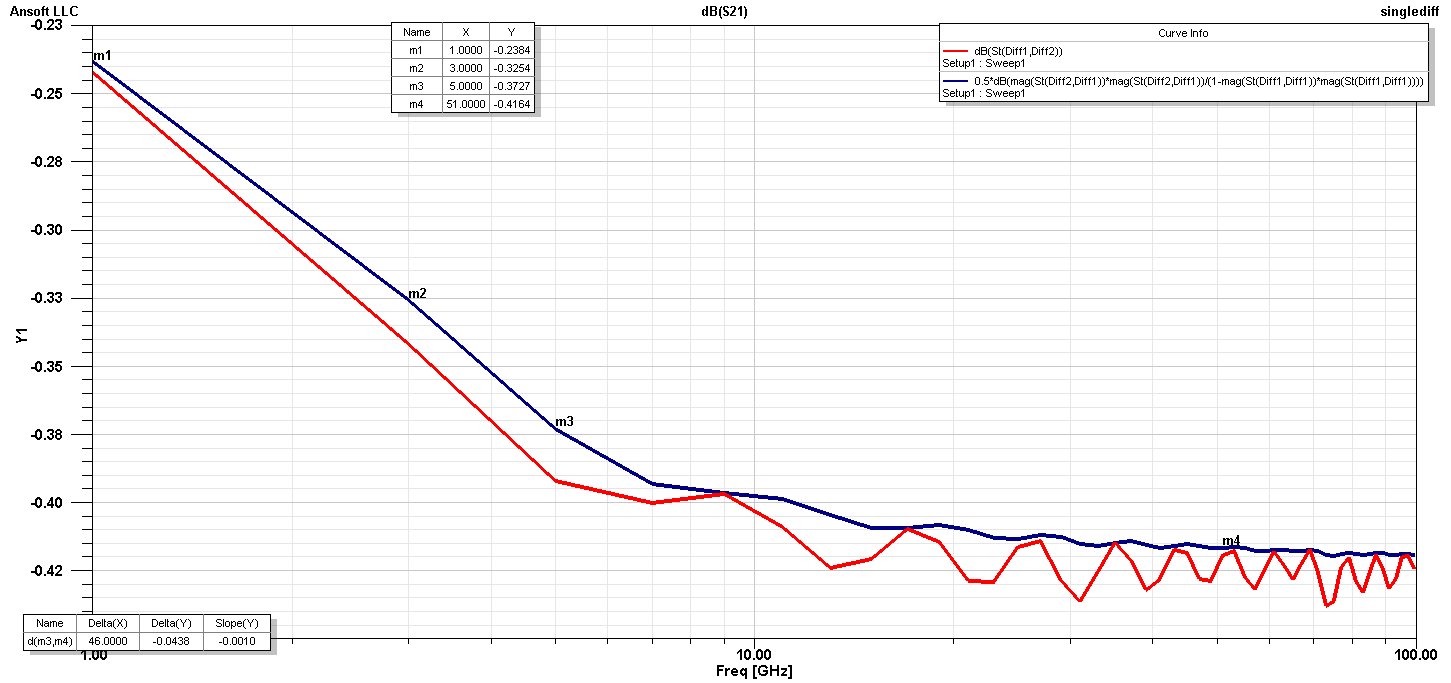
Please check the results above. I am wondering what"s wrong...
Hello!
please, Can you tell me how you get the conductor loss from the HFSS results? I mean from the S-parameters.
Thanks in advance