Plotting gain against an optimetrics variable in HFSS
时间:03-30
整理:3721RD
点击:
I'm trying to compute the realized gain of an antenna in HFSS at a spot frequency of 5.8 GHz. I've put the dimensions of the antennas as parameters. One of the parameters is "s2_1", which starts off at 26
mm.
I can get the properties of the antenna using that. But I want to see how the properties of the antenna change as this variable is changed, so I set up HFSS to use optimetrics, and swept the parameter over the range 5 to 80 mm in steps of 5 mm.
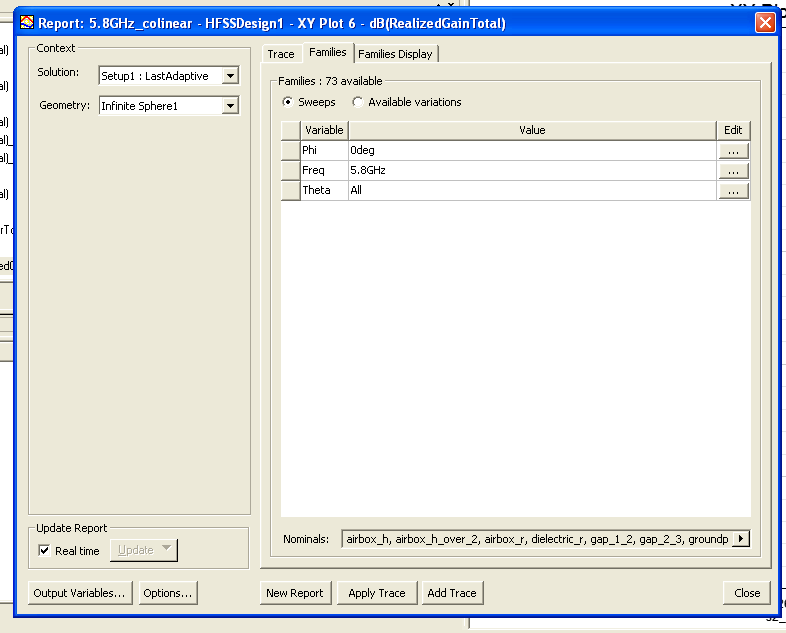
I then want to plot the gain of the antenna against the variable s2_1. So I changed the default x-axis to show the variable s2_l
and changed the angle phi to be 0, as this antenna is virtually symmetrical about the z-axis.
I can only appear to do this for the case theta=0, phi=0, but any attempt to do it for other directions in the far-field result in it only showing the data at the default value of s2_l, so it looks like this.
Can anyone explain how to plot gain vs the optimetrics variable s2_l, for all values of theta, and a fixed phi of 0 degrees? So with the same x and y axis variables, but with x swept from 5 to 80 mm, and curves instead of spot values at s2_l is 26 mm.
See the attached images and the .hfss file
mm.

I can get the properties of the antenna using that. But I want to see how the properties of the antenna change as this variable is changed, so I set up HFSS to use optimetrics, and swept the parameter over the range 5 to 80 mm in steps of 5 mm.

I then want to plot the gain of the antenna against the variable s2_1. So I changed the default x-axis to show the variable s2_l

and changed the angle phi to be 0, as this antenna is virtually symmetrical about the z-axis.
I can only appear to do this for the case theta=0, phi=0, but any attempt to do it for other directions in the far-field result in it only showing the data at the default value of s2_l, so it looks like this.

Can anyone explain how to plot gain vs the optimetrics variable s2_l, for all values of theta, and a fixed phi of 0 degrees? So with the same x and y axis variables, but with x swept from 5 to 80 mm, and curves instead of spot values at s2_l is 26 mm.
See the attached images and the .hfss file