EPOT应用:增益调整的运算放大器电路
时间:03-28
来源:本站整理
点击:
- No current through the wiper.
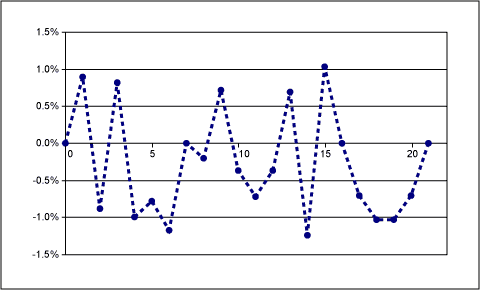
- A linear gain adjustment curve with better than 3% error. This is better than 1 LSB for a 32 tap EPOT.
- Eliminate any dependence on absolute resistance Re.
1. Pick a maximum and minimum gain. For this example a minimum of 2 and a maximum of 10 was chosen. Empirical testing shows that this method works pretty well for gains of up to about 20.
2. Find the actual possible maximum gain. The actual maximum gain is the gain that will be a solution to the equation
G(n) = n/(256 - n) n=0,1,2...
For this example, solving for a G(n)=10 gives n=232.72. Since only whole values of n are available, select n=233. The actual maximum gain is then G(233)=233/(256 - 233) = 10.13.
3. Get the slope m. The slope m could also be called the step size, as it will correlate to the gain steps between values of n. The recommended method is to use the average gain change over the last 5 values of n in the range of interest. In other words,
m= [G(nmax) - G(nmax -5)]/5
The decision to use the last 5 values is somewhat arbitrary and the designer is encouraged to experiment with other values. For this example, m=[G(233) - G(228)]/5=0.398.
4. Find the actual possible minimum gain and the number of steps. In order to be certain that the minimum gain is a possible solution to the line being created, the equation for y=mx+b can be solved. Since a discrete system is being used, simply find the number of steps between the max gain and the expected min gain (chosen in step 1), where
max steps = [G(nmax) - Gmin]/m.
For this example, max steps = [10.13 - 2]/0.398=20.4. Once again, only a discrete number of steps is available, so round up the result to increase the maximum number of steps to 21. Therefore, the actual minimum gain is going to be 21 steps of 0.398 each less than the maximum gain or
Gmin= G(nmax) - (max steps) × m = 10.13 - (21 × 0.398) = 1.772.
5. Get the intercept b. The value for b or the y intercept is simply the min gain.
The result is the equation
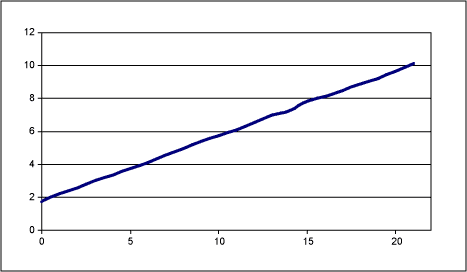
f(x)=0.398x + 1.772, where x=0,1,2...21.
This equation can be used to find the values of n or the EPOT settings that are used to get this straight line gain curve. This is done by solving G(N) = n/(256 - n) = f(x). The actual implementation is up to the designer, but basically the options are to either use a lookup table or to solve for the value of n on the fly.
A plot of the gain for this example is shown below as a function of x.
Figure 6. Gain curve for software compensated example.
The deviation from the ideal straight line is plotted below as a percentage.
Figure 7. Deviation from ideal as a percentage.Summary
In this article, simple EPOT adjustable gain block configurations have been discussed, along with the advantages and disadvantages of each. The EPOT has important characteristics that must be considered when being used in a design. One of the cleanest ways of preventing these characteristics from limiting the performance of the circuit results in a non-linear gain adjustment curve, which may not be desirable. Finally, two ways of compensating for that non-linear curve are presented. This would allow the EPOT to be used in a way where many of its constraints are not a factor and linear gain is still achievable.
放大器 相关文章:
- 分析测量放大器的共模抑制能力(09-15)
- 开关模式GaAs功率放大器在WLAN设计中大放异彩(09-30)
- 利用高端电流检测放大器简化模拟电路设计(09-15)
- 运算放大器选择指南 助您获得上佳的噪声性能(09-10)
- 运算放大器组成阶梯波发生器电路图(10-11)
- 电容器与声音的关系(11-04)
