sp analysis+cadence
时间:04-08
整理:3721RD
点击:
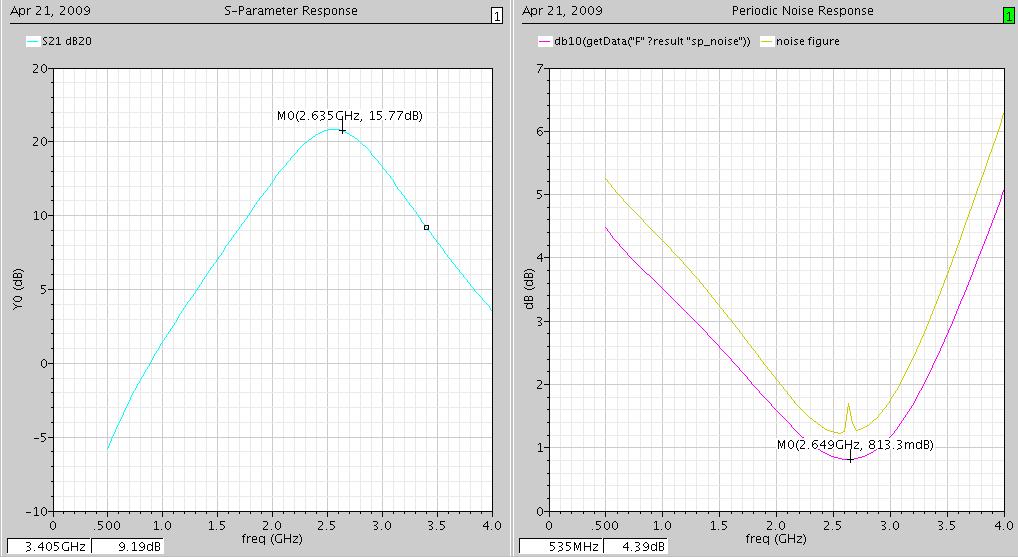
When I simulated the NF of a narrowband LNA use pnoise and sp analysis, some unpredicted difference results turned on as shown in Fig.1.
In the right subwindow, the yellow above line is the NF result by pnoise analysis, the other one is sp results.There are two differecces:
1)the NF of pnoise analysis is larger on the whole
2)there is a peak of NF of pnoise analysis
I did both the analysis follow the SpecterRF_UserdGuide_2003 realsed by Cadence.In fact, I know not so much about the pnoise and sp analysis settings. Could someone explain the results for me or show me how to do the correct analysis of the LNA NF.
Best wishes!
when you did the pnoise simulation, did you check the input power?
Thank you noiseless and sorry for my late replay~~
I have cheked the input power of the port and the value is -30dBm according the results that I uploaded before.
I try to decrease the input power and when it reaches -100dBm, the peak dispare. Is it because the Voltage Gain of the LNA too larger?(the input power is -10dBm when doing the pnoise simulation)
- HSPICE as simulator in advance design system (ADS) for pole/zero analysis
- Analogue spectrum analyzer marker and tracking generator plugin
- Response of the TLINE for different frequencies and lengths
- Designing split ring resonator
- How do I know if a spectrum analyzer is enough to measure an specficic DAC?
- Do you know the basic specification requirements for optical fiber connection?