Plot NF vs QL in Cadence
时间:04-08
整理:3721RD
点击:
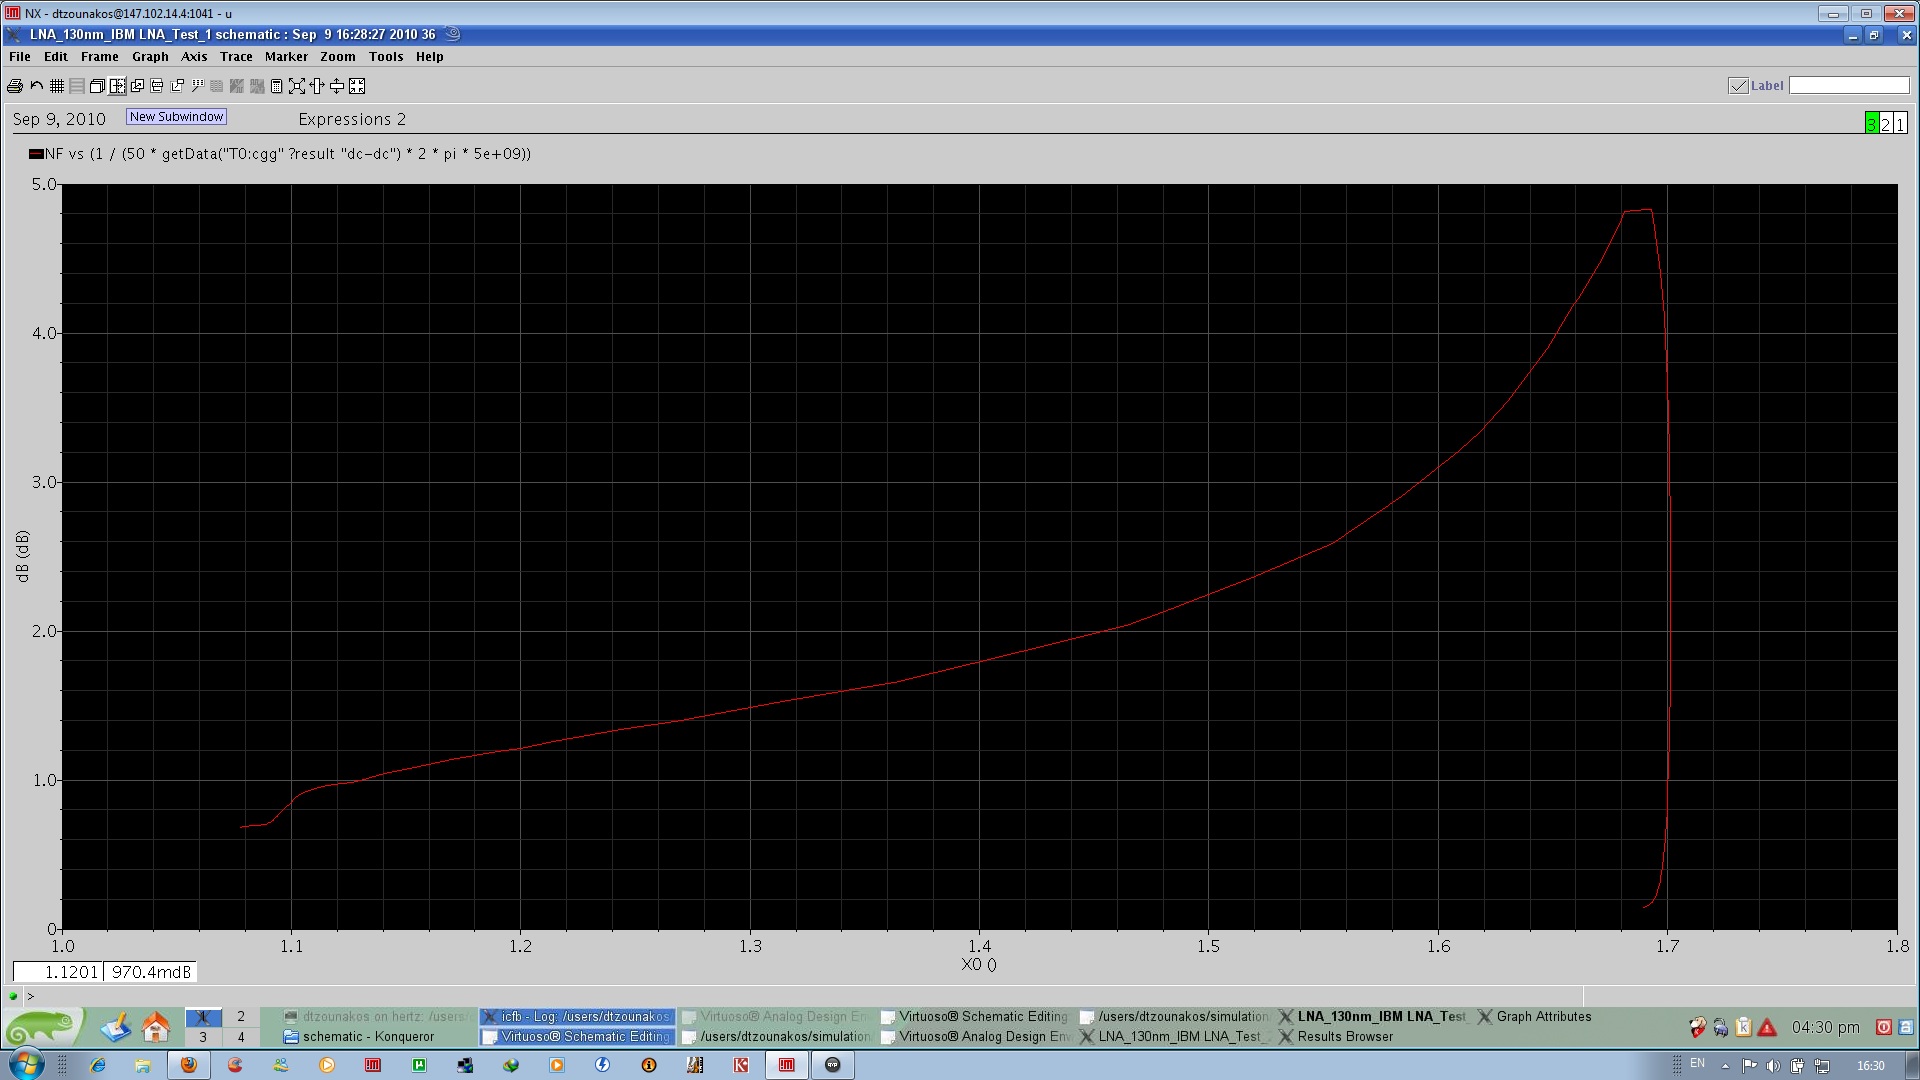
Does anyone know how to plot NF vs QL in Cadence where QL=1/(Rs*Cgg*Ωο)?
I did the following simulation steps:
1) I defined QL in calculator window
2) I ran a Noise Analysis simulation at 5Ghz (Sweep Variable=Vgg 0->1.2)
3) I Plotted both NF vs Vgg and QL vs Vgg at the same graph windows and then
plot NF vs QL using Axis attribute window
and the resulted graph is:
which i think is WRONG!
And another question.
Does Cadence calculate correctly the noise parameters NF, NFmin, Rn e.t.c?
Thanks a lot!
- How do I plot load pull contours using values from ADS plots (P1_Contours) in excel?
- Real time plotting of radiation pattern using matlab
- Can you plot loadpull contour plots from impedance values ?
- Comparison of two antenna polar plots
- How to plot Pout A1 dB compression point versus frequencies
- How to plot Loadline in cadence spectre