Transconductance Vs Real & Imag of Z in Cadence Spectre
时间:04-07
整理:3721RD
点击:
Hello,
I am facing issues when I try to plot transconductance Vs impedence plots.
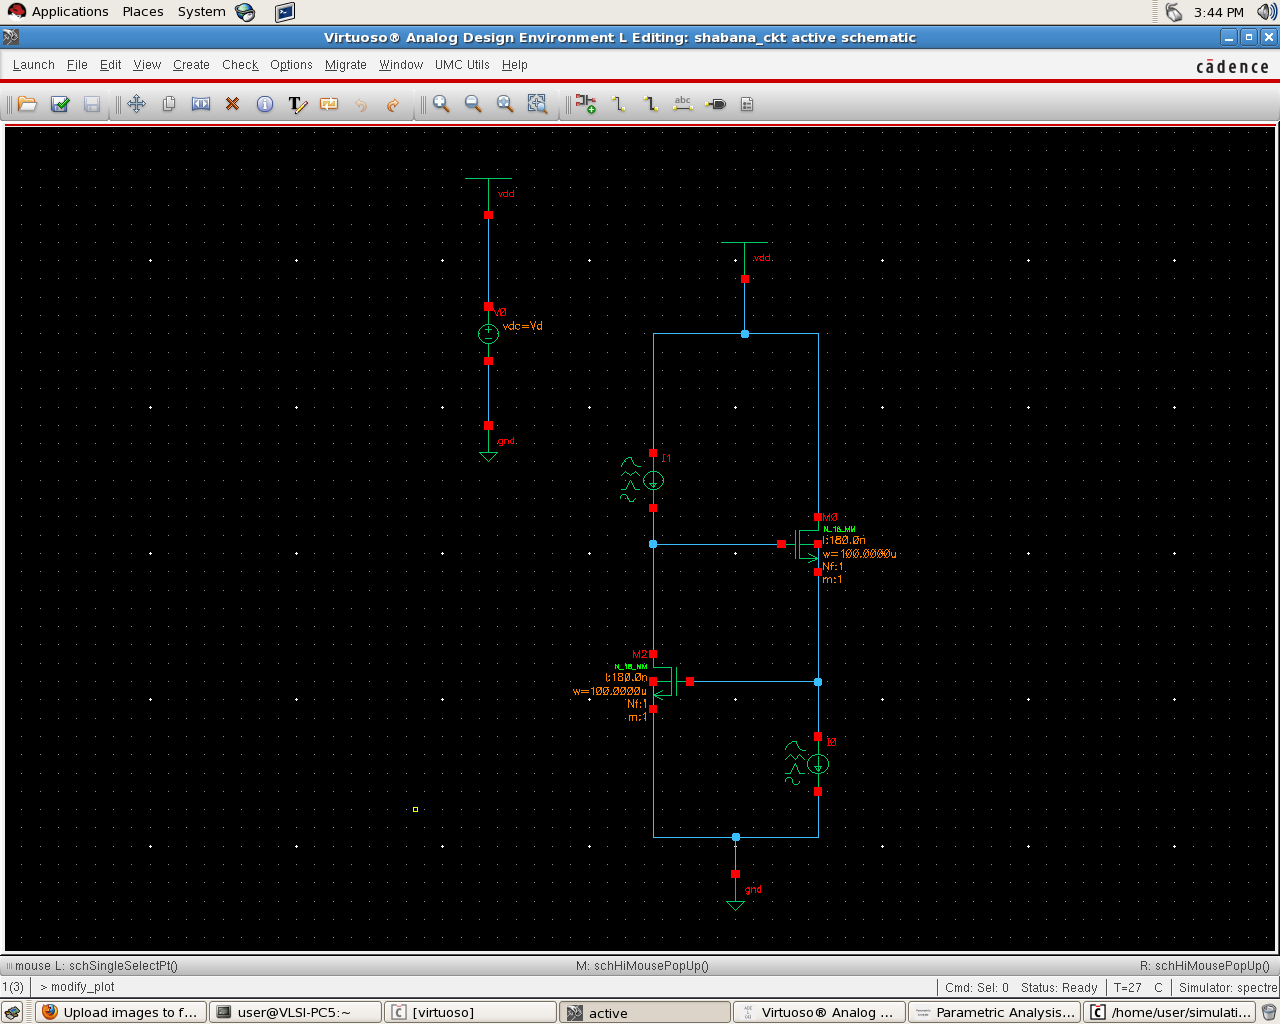
Attached is the schematic.
Below is how I proceeded:
1. I set the values of I1(350uA) and I2(600uA) and varied Vdd from 0 to 1.8v. Set the analysis as dc and I enabled the "set the dc operating point"
2. I did parametric analysis by sweeping the voltage and then using calculator, expression for Z is set as output.
3. Then using Tools->Results Browser -> dcOpinfo-info -> plotted gm of the respective mosfets.
So, all my voltage and current sources are dc.
Interestingly, the imaginary part of the impedence is always zero when plotted.
I planned to table the contents of the plot, convert it to .csv and using matlab plot graph between gm and impedence.
What may be the issue? Am I doing wrong at any part?
Please help me.
Impedence variations can be seen through ac analysis. gm is constant with variation of frequency. gm variations can be seen through dc analysis. How to proceed?
I am facing issues when I try to plot transconductance Vs impedence plots.
Attached is the schematic.
Below is how I proceeded:
1. I set the values of I1(350uA) and I2(600uA) and varied Vdd from 0 to 1.8v. Set the analysis as dc and I enabled the "set the dc operating point"
2. I did parametric analysis by sweeping the voltage and then using calculator, expression for Z is set as output.
3. Then using Tools->Results Browser -> dcOpinfo-info -> plotted gm of the respective mosfets.
So, all my voltage and current sources are dc.
Interestingly, the imaginary part of the impedence is always zero when plotted.
I planned to table the contents of the plot, convert it to .csv and using matlab plot graph between gm and impedence.
What may be the issue? Am I doing wrong at any part?
Please help me.
Impedence variations can be seen through ac analysis. gm is constant with variation of frequency. gm variations can be seen through dc analysis. How to proceed?