negative resistance in tranmission line SPICE model
I extrace RLCG using the method propose in "S-Parameter-Based IC Interconnect Transmission Line Characterization"
William R. Eisenstadt, Senior Member, IEEE, and Yungseon Eo
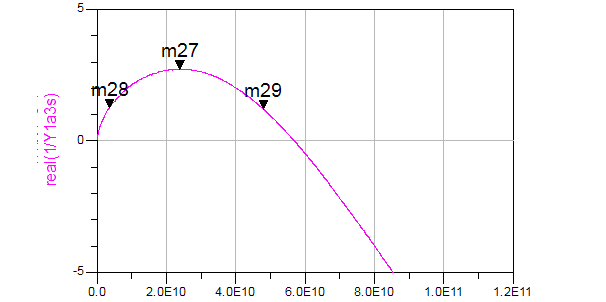
the length of the TL is 500um, in about 60Ghz,the R is come to zero and then to negative. I think negative R is no useful in the SPICE model,What can do ?
And the second quetion is : the R become more and more larger at the beginning ,but why come to small after the largest point ?as show in the picture.How to model this pheonomenon?
Thank in advance!
I can't see from the diagram, if the shown parameter is showing a RLGC model parameter. It would be pysically inplausible of course. But you should notice, that the frequency variable RLGC parameters are of little use for a SPICE simulation. A negative real part of resistance can be used in simulation models as long it's compensated by positive resistors in the circuit.
I generally doubt, that the negative parameters are rather caused by a phase dispersion of the device under test, so that the calibrated reference plane isn't valid.
When you extract lines over lossy silicon substrate, and interpret results as a PI model, you will indeed see negative series resistance at high frequencies. This is caused by current flow in the lossy substrate and indicates that your PI model with only one resistor for series loss is somewhat too simple for this case. Of course, laws of physics still apply and total loss is > 0.
Is there any papers to solved this problems? Thks~
Hi volker_muehlhaus
why "current flow in the lossy substrate " will see negative series resistance ? I can't understand. what model will be OK to fix this problem?
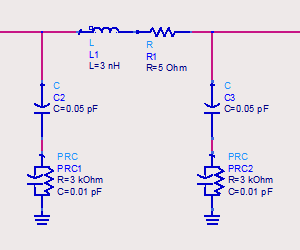
Try it in your circuit simulator: here is the model for a piece of line over silicon. Extract the series R of the Pi model and you will see that it gets negative at high frequencies.
I know the problem, but don"t know an easy solution.
Thank You very much!
I'm not sure, if there's an actual problem. The losses are represented by the combination of G and R and are always positive.
I wish it was that simple. Simple RLCG line models do not represent the physics of lines over silicon very well.
The problem is the shunt path, with an impedance that varies heavily with frequency due to the physics of silicon integrated circuit. As seen in my schematic above (the most common RFIC line/inductor model), you have the frequency independent oxide capacitance, in series with the substrate R-C.
Problem with reducing that to RLCG: how to lump that into a single GC-value that is valid at more than one frequency. Problem2: Return current flows in the silicon, which is not properly represented by my model above (needs more complicated model with extra R-C between the two shunt branches).
I think, the RLCG model generally isn't suitable for the description of transmission lines in a wider frequency range. If you apply it to coaxial cables, the model fails to describe skin effect losses appropriately. So the wide band behaviour, that e.g. shows in pulse distortions created by the cable, can't be modelled correctly.
If you use the model for a lumped element description at a single frequency, there's no problem. But then the model isn't of much use. I understand, that the suggested RFIC transmission line model promises a better approximation of real behaviour with frequency indepdendent elements.
tranmission resistance model 相关文章:
- How does one model tranmission line in SPICE simulation program
- tranmission zeros of bandpass filter
- Diode detector Tranmission Line Problem
- Adding ports to know resistance at some point in 2-patch antenna
- Microstrip Negative Resistance Oscillator Nyquist plot Encirclement issues
- What is the gate resistance of the LDMOS?