How to measure conduction angle in ADS for Power Amplifiers?
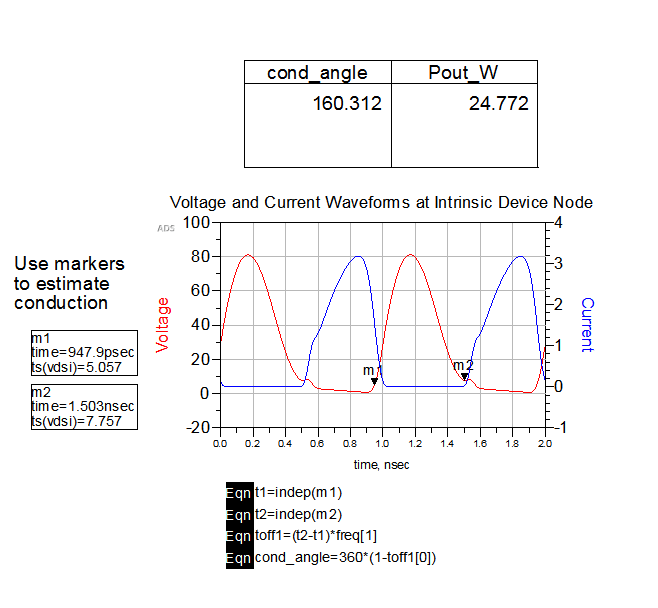
I would like to measure conduction angle of my PA. I found a ADS simulation file from Keysight. They have measured the conduction angle in that file, but when I try to use the equations, I cannot see the result. The point is when I type "freq[1]" which is frequency (first harmonic), the equations become red, which means they are not true!
Do you have any idea?


What analysis do you use ?
Do you use HB ?
Show me content list of your "*.ds* file.
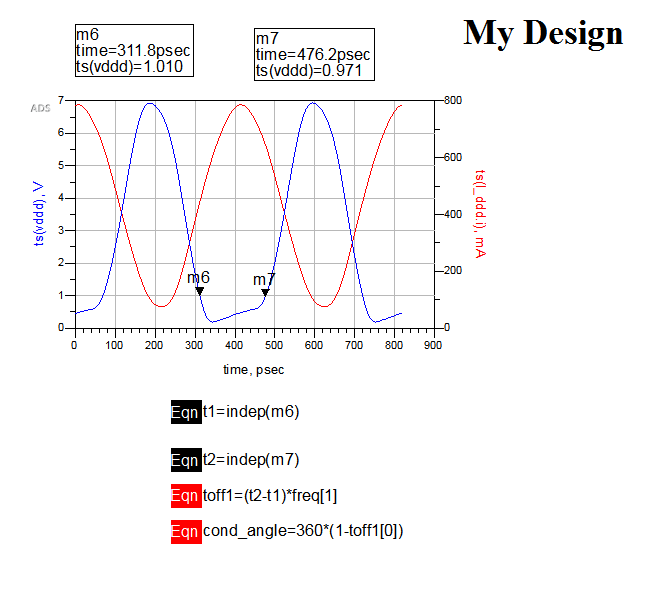
In your data display, m1 and m2 don't exist.
Show me result of what(vddd) and what(Iddd.i).
Thank you for your help.
Yes, I am using HB. I am trying to see inside of the ".ds" file. How can I open it?!
Sorry, you are right. I editted the photo!
Use Dataset Browser
http://edadocs.software.keysight.com...Display+Basics
In your data display, m1 and m2 don't exist.
t1=indep(m6)
t2=indep(m7)
toff1=(t2-t1)*freq[1]
cond_angle=360*(1-toff1[0])
Show me result of followings.
List what(vddd)
List what(I_ddd.i)
List what(toff1)
http://edadocs.software.keysight.com...ageId=58329572
freq[1] is short name.
It might be required for full name.
Show me list content of "*.ds" or ADS netlist.
I tried to read it but I faced an error: "read failed"
I uploaded my design. Could you please take a look on that?My schematic NewDesign2
Simply rerun simulation.
Then show me ADS netlist.
https://www.edaboard.com/thread346180.html
If so, how to plot ts(vddd) and ts(I_ddd.i) ?
I think this is the netlist:
Warning detected by hpeesofsim in LinearCollapse '_2_' during analysis.
LinearCollapse is disabled since there is 'HB'analysis present.
Warning detected by hpeesofsim in topology check during circuit set up.
Number of nodes with only one device attached (topology corrected): 2
Number of nodes with no DC path to ground (topology corrected): 2
HB HB1[1] <ATF_52189_lib:NewDesign2:schematic>
Pt DC convergence is used.
Warning detected by hpeesofsim during TRAN analysis `HB1'.
COMPONENT `I__79.em_data':
Simulator uses frequency lower than frequency range of model. The S-parameters are extrapolated.
Warning detected by hpeesofsim during TRAN analysis `HB1'.
COMPONENT `I__79.em_data':
S-parameter passivity is enforced.
Warning detected by hpeesofsim during TRAN analysis `HB1'.
COMPONENT `I__79.em_data':
Model data retrieved from <ATF_52189_lib:Source-Pad2:emModel>
Number of tones: 1.
Number of frequencies: 10.
Number of time samples: 32.
Number of HB equations (problem size): 2660.
Auto mode: on.
Convergence mode: Auto.
Linear solver: direct.
Warning detected by hpeesofsim during AC Analysis 'HB1'.
UserValue(7.866667) > MaxRecommendValue(5.000000) for 'Wlargest/Wsmallest' in `Tee4'
Warning detected by hpeesofsim during HB analysis `HB1'.
COMPONENT `I__79.em_data':
Simulator uses frequency higher than frequency range for model. The S-parameters are extrapolated.
------------------------------------------------------------------------------
Newton solver:
Iter KCL residual Damp % Sol update
------------------------------------------------------------------------------
0.0* 12.8681 A 100.0
1.0 3.18067 A 100.0
1.1 956.371 mA 100.0
1.2 795.712 mA 100.0
1.3* 361.672 mA 100.0
2.0 72.182 mA 100.0
2.1 28.2305 mA 100.0
2.2 13.2019 mA 100.0
2.3 6.98416 mA 100.0
2.4 3.65232 mA 100.0
2.5 1.99599 mA 100.0
2.6 1.09022 mA 100.0
2.7 613.005 uA 100.0
2.8 336.144 uA 100.0
2.9 191.187 uA 100.0
2.10 105.679 uA 100.0
2.11 59.7416 uA 100.0
2.12 33.1805 uA 100.0
2.13 18.6881 uA 100.0
2.14 10.4099 uA 100.0
2.15 5.84976 uA 100.0
2.16 3.2645 uA 100.0
2.17 1.83185 uA 100.0
2.18 1.02345 uA 100.0 529.714 nV
An HB truncation error may be present.
o The HB truncation error is due to using a finite order
(number of harmonics) in the representation of the
circuit signals.
Waveform Trunc error Tolerance
---------------------------------------------------------
X1.X1.FET1.d 1.911e-04 > 2.760e-06
X1.X1.FET1.ids 3.881e-05 > 1.210e-06
X1.X1.FET1.g 1.874e-05 > 1.193e-06
N__19 6.487e-06 > 4.094e-06
X1.X1.FET1.s 5.083e-06 > 1.131e-06
o Number of waveforms violating the HB truncation error check:
6 out of 6 waveforms.
o Estimated max HB truncation error: 1.911e-04 @ waveform X1.X1.FET1.d .
o The maximal HB truncation error estimate is greater than the
achieved tolerance of 2.760e-06 for this waveform.
o To reduce the error, increase the order (number of harmonics)
and re-simulate.
SP SP1[1] <ATF_52189_lib:NewDesign2:schematic> freq=(2 GHz->3 GHz)
,,,,,,,,,,,,,,,,,,,,,,,,,,,,,,,,,,,,,,,,,,,,,,,,,, ,,,,,,,,,,,,,,,,,,,,,,,,,,,,,,,,,,,,,,,,,,,,,,,,,, ,
Resource usage:
Total stopwatch time = 0.90 seconds.
No, this is not netlist.
Surely read my append.
You run multiple analyses at once.
At least, two freq exist in your "*.ds".
One is for SP1, the other is for HB1.
So you have to specify full name.
HB1.HB.freq[1] or HB.HB1.freq[1]
Show me content list of "*.ds" or ADS netlist.
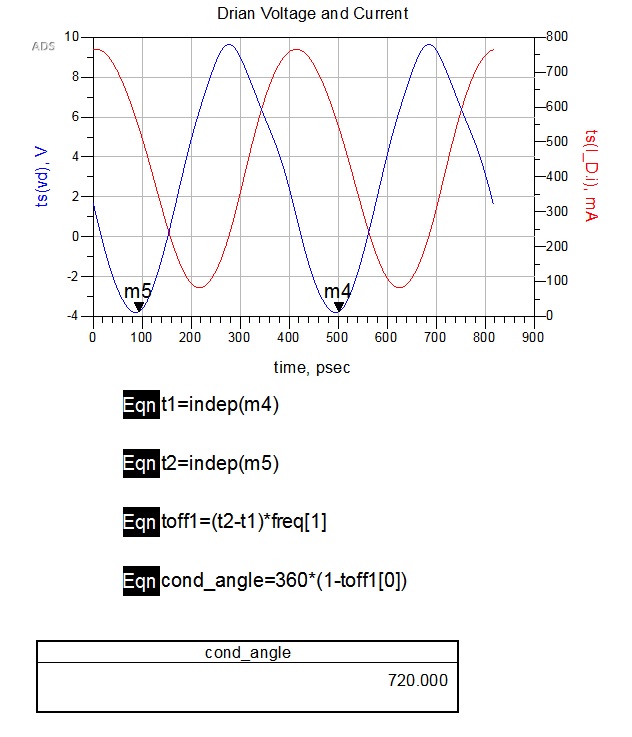
I turned off s-parameters simulator and just used HB. It worked!
But value for conduction angle is weird! 720 degree!

Simply your equation for conduction angle is completely wrong.
HaHaHa!
The equation is not mine! This is from keysight!
Look:
https://www.youtube.com/watch?v=iABwHeZ3_Jw
Don't believe anything blindly.
change t2-t1 to t1-t2.
angle conduction measure 相关文章:
- In which direction we need to go and read the reflection coefficient angles.
- S11 phase angle of waveguide vs microstrip line analogy. Is it correct?
- Operations on S parameters - value of angle
- Formula for flare angle of the bowtie antenna
- How do I know if a spectrum analyzer is enough to measure an specficic DAC?
- Using ADS2019, How to set and measure tempature values for LNA?
