S21 graphs, comparison and understanding
时间:04-04
整理:3721RD
点击:
Hello, i have measured S21 parameter on network analyser and i need to right dow its characteristics and made a comparison with another s 21 graph .
Kindly let me know what one must right whe explaining S21 graph.
i am uploading graphs here.
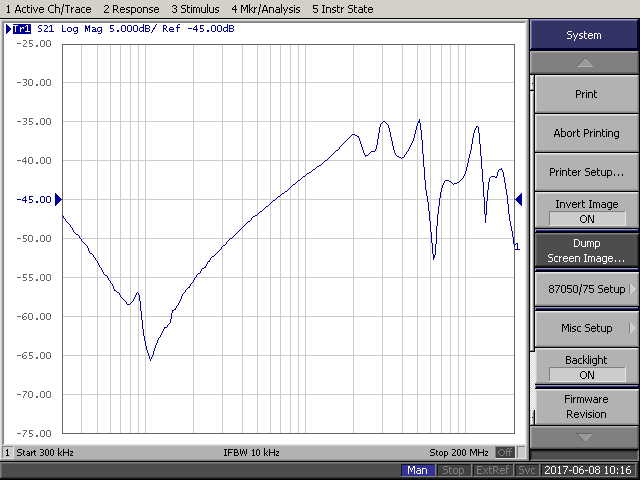
1st graph
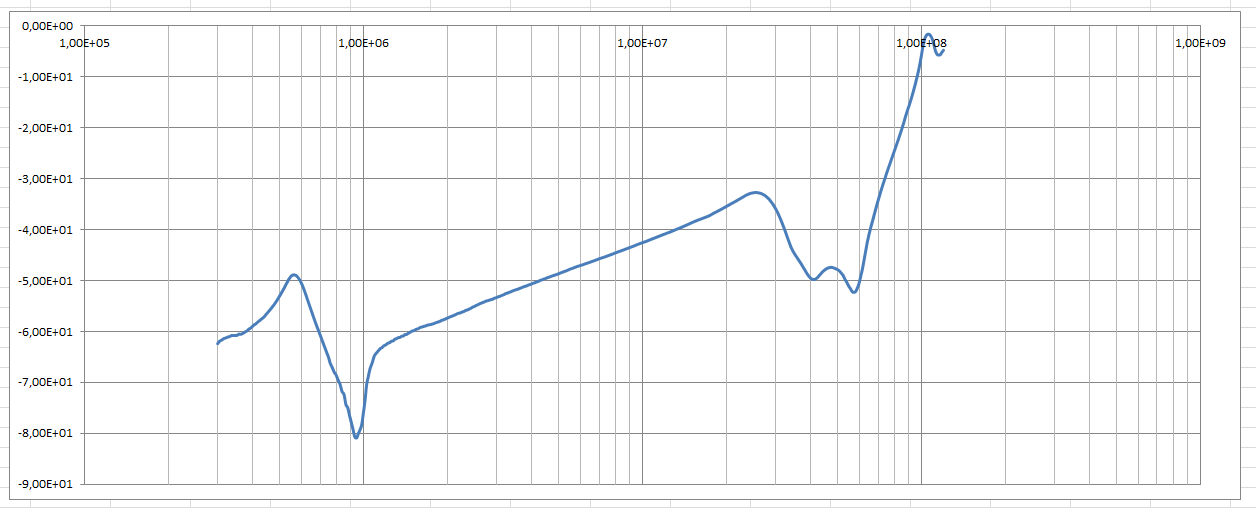
2nd graph
Kindly let me know what one must right whe explaining S21 graph.
i am uploading graphs here.
1st graph
2nd graph
Who can know your DUT ?
If you want to be helped, you have to learn how to describe technical documents.
Sorry i am new here. My Device under test is a Passive filter enclosed in a box. I am measuring in between 300MHz and 200 GHz.
Who can know what filter you use ?
Again surely learn how to describe situations.
Your 1st plot from post#1 shows frequency from 300 kHz to 200 MHz.
I agree with pancho_hidebo. Both S21 magnitude curves show an attenuation of > 35 dB for most frequencies. We really can't know if this an intended behavior (e.g. a filter no suppress any RF on a low frequency or DC line) or failure.
According to the first diagram factor 1000 lower frequency.