help me to interpret the result from the graphs shown below.
Explain more about this graph. Means which sort of experiement is this? What is X-axis? what is dimention? Please be more specific in your question. Otherwise no one can answer.
Mitultailor is right You can make inferences only when the parameters involved are known
A wild GUess
Y axis seems some gain plotted in dB...some kind of gain plot...
if X is frequency then it is bode ......
But the above Inference is just a guess ..one among many interpretations ....Please provide the X axis Quantity .....Only then We can Arrive at conclusions
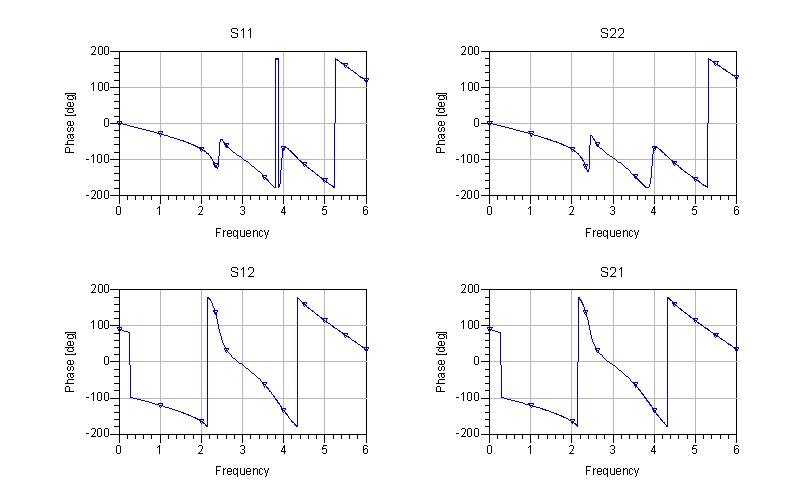
Guys, this is a plot from ADS Momentum with S11/S22 return loss [dB] plotted over frequency [GHz].
Not sure what type of interpretation the OP wans to have. He should know what he analyzed.
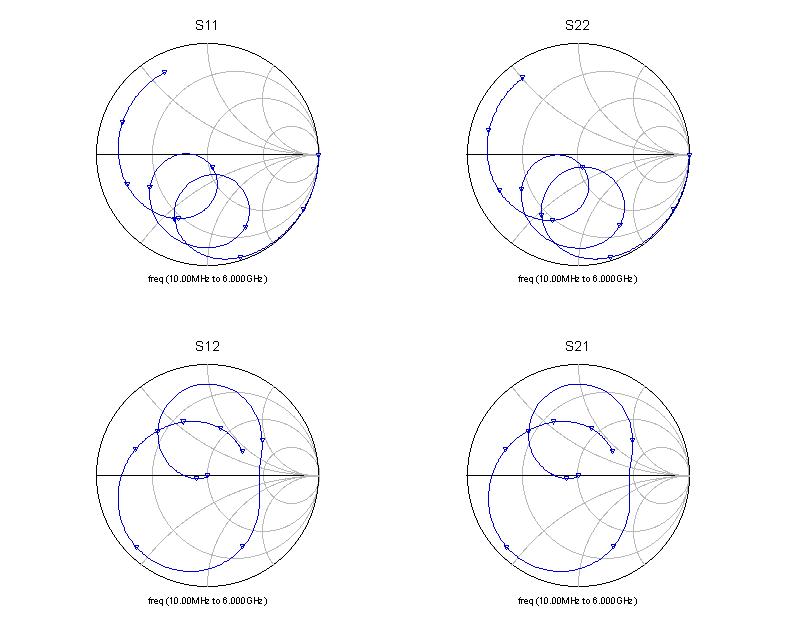
Hello Actually i am doing a simulation of a CRLHTL( filter) in ADS and i want to know the interpretation from the simulation results.I am attaching the image,the S parameters(bar graph and the smith chart).Please help me in interpreting the figure