HFSS - Please help me plot a graph with different traces for a swept parameter.
时间:03-30
整理:3721RD
点击:
I want to plot the Gain (dBi) vs Frequency (GHz) of an antenna on a 2D graph using:
HFSS -> Results -> Create Far Field Report -> Rectangular Plot
but have a different trace for each variation of a parameter which was swept using
HFSS -> Optimetrics Analysis -> Add Parametric
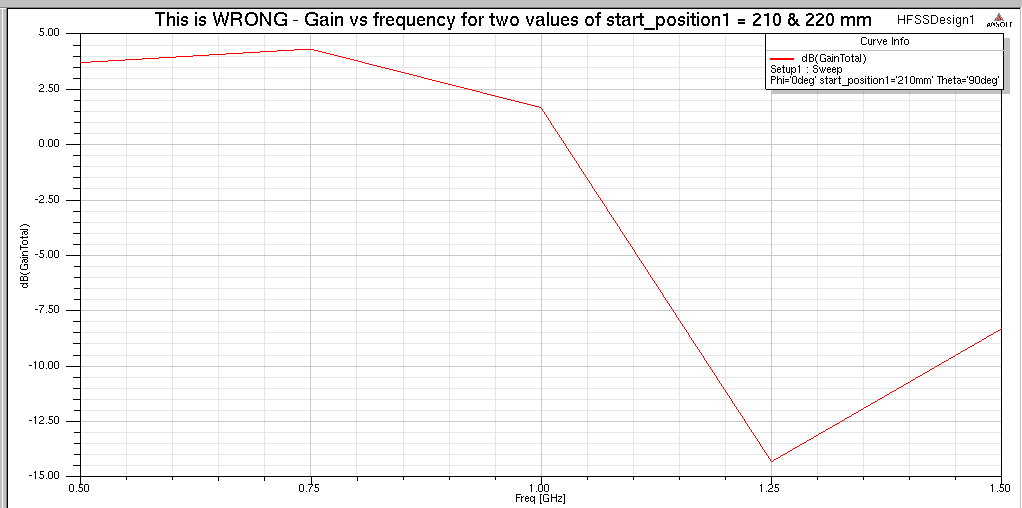
I have used a Discrete frequency sweep. Since there are two values (210 mm and 220 mm) of the parameter I called 'start_position1', I want two traces. However, there is only one trace as shown. (I've attached the .hfss file, in case it helps. I made various changes from my original file to make it run faster. It should only take 10 minutes or so to run - a lot less if you have a DSO license).
I want to plot the graph with:
But as you can see above, it is only plotting Θ=90°, Φ=0° , start_position1=210 mm, and not showing a trace with Θ=90°, Φ=0° , start_position1=220 mm, (The value of start_position1 is defined as 210 mm in the model, but of course I want to sweep that value using the Optimetrics)
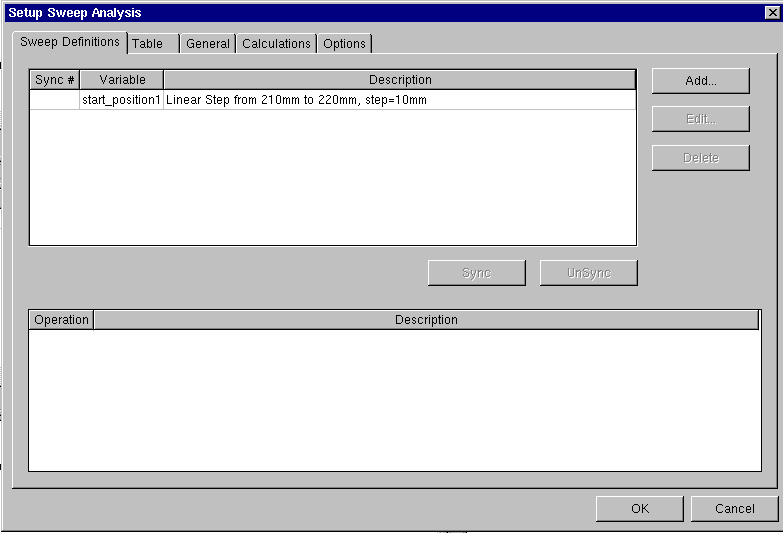
Here's my Parametric Sweep setup, using HFSS -> Optimetrics Analysis -> Add Parametric The simulation runs OK, with no warnings.
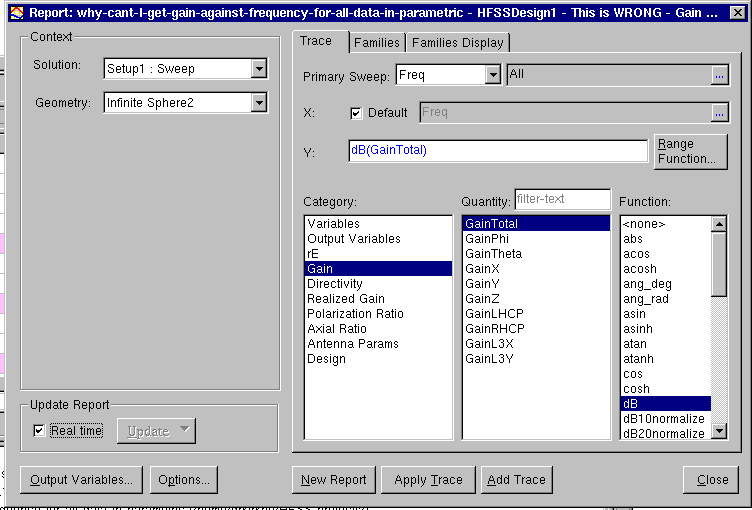
Here"s how I have tried to plot the gain vs frequency, with HFSS -> Results -> Create Far Field Report -> Rectangular Plot
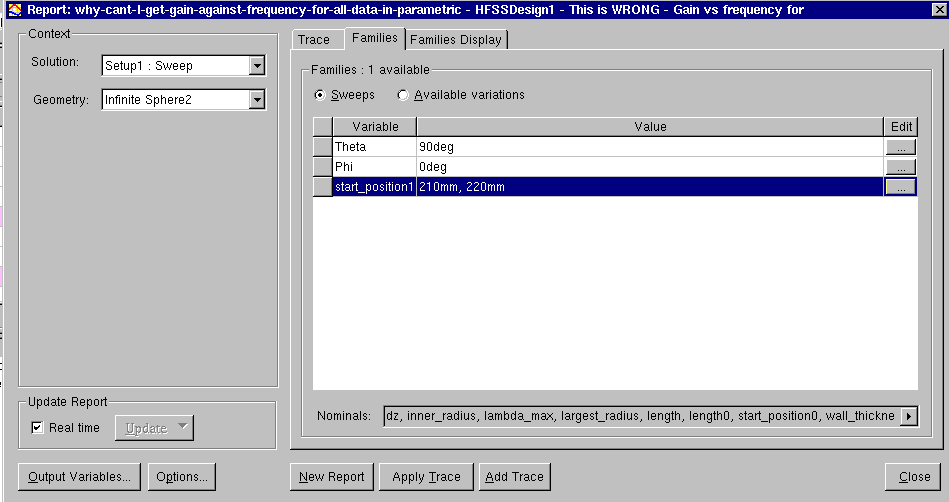
Here is the "Families Tab" of HFSS -> Results -> Create Far Field Report -> Rectangular Plot . Note this shows two values for start_position1.
I"m not sure what (if anything) I should expect on the Families Display tab of HFSS -> Results -> Create Far Field Report -> Rectangular Plot , but I see nothing at all.
Can anyone suggest how I might show two traces? I'd appreciate it very much.
Deborah.
HFSS -> Results -> Create Far Field Report -> Rectangular Plot
but have a different trace for each variation of a parameter which was swept using
HFSS -> Optimetrics Analysis -> Add Parametric
I have used a Discrete frequency sweep. Since there are two values (210 mm and 220 mm) of the parameter I called 'start_position1', I want two traces. However, there is only one trace as shown. (I've attached the .hfss file, in case it helps. I made various changes from my original file to make it run faster. It should only take 10 minutes or so to run - a lot less if you have a DSO license).
I want to plot the graph with:
- Phi=0°
- start_position1 (my parametric variable) = 210 mm and 220 mm
- Theta=90°
But as you can see above, it is only plotting Θ=90°, Φ=0° , start_position1=210 mm, and not showing a trace with Θ=90°, Φ=0° , start_position1=220 mm, (The value of start_position1 is defined as 210 mm in the model, but of course I want to sweep that value using the Optimetrics)
Here's my Parametric Sweep setup, using HFSS -> Optimetrics Analysis -> Add Parametric The simulation runs OK, with no warnings.
Here"s how I have tried to plot the gain vs frequency, with HFSS -> Results -> Create Far Field Report -> Rectangular Plot
Here is the "Families Tab" of HFSS -> Results -> Create Far Field Report -> Rectangular Plot . Note this shows two values for start_position1.
I"m not sure what (if anything) I should expect on the Families Display tab of HFSS -> Results -> Create Far Field Report -> Rectangular Plot , but I see nothing at all.
Can anyone suggest how I might show two traces? I'd appreciate it very much.
Deborah.