MATLAB
explain more, give an example, where you can convert to polar and plot it or others .
just give me your equation.
I want to plot the graph for exp(-j*x) wrt to x
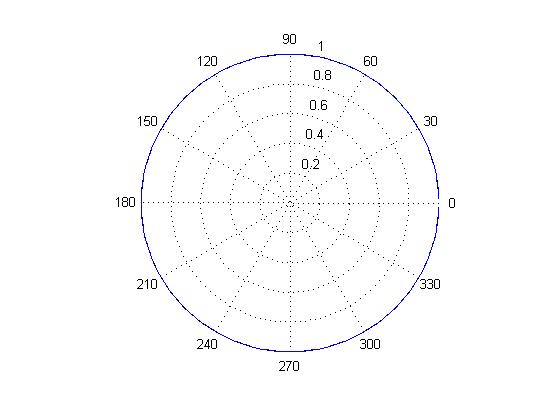
In polar Plot:
just convert your equation to polar form before any programming
x=0:pi/100:2*pi;
r=abs(exp(-i*x));
the=angle(exp(-i*x));
polar(the,r)

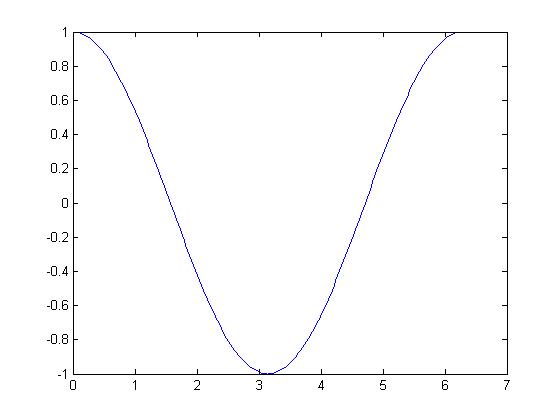
now if you want to plot it directly, the imaginary part will be ignored as below
x=0:pi/100:2*pi;
y=exp(-i*x);
plot(x,y)
Warning: Imaginary parts of complex X and/or Y arguments ignored
>>

best regards
how about 2D exponetial graph?
say x[n1,n2]=exp(j*(w1*n1+w2*n2))
how to draw the x wrt n1 and n2?
I think this isn't possible. You need two axis to plot x (one for the real part and one for the imaginary part - or the magnitude and the phase) and you need one axis for n1 and one for n2. Thus, you need four axis to plot, but we have only three.
You can create two 3d-plots: one with the real part of x versus n1 and n2 and one with the imaginary part of x versus n1 and n2.
Or you can use the magnitude and phase instead of the real and imaginary part, this depends on your needs.
oh, i see. i think it is impossible too.
- - - Updated - - -
oh, i see. i think it is impossible too.
