Simulation of Electromagnetics
It is not clear neither the properties of the material, the geometry, and the dynamics of the electromagnetic field that you want to examine. Anyway, you can find several examples at Mathworks website related to this subject.
But i don't know how to creat a simulation like this in matlab. I tried some functions such as imagesc or contour but it not be specified.
Hi,
Do you want to plot the figure from a data file or perform simulation ?
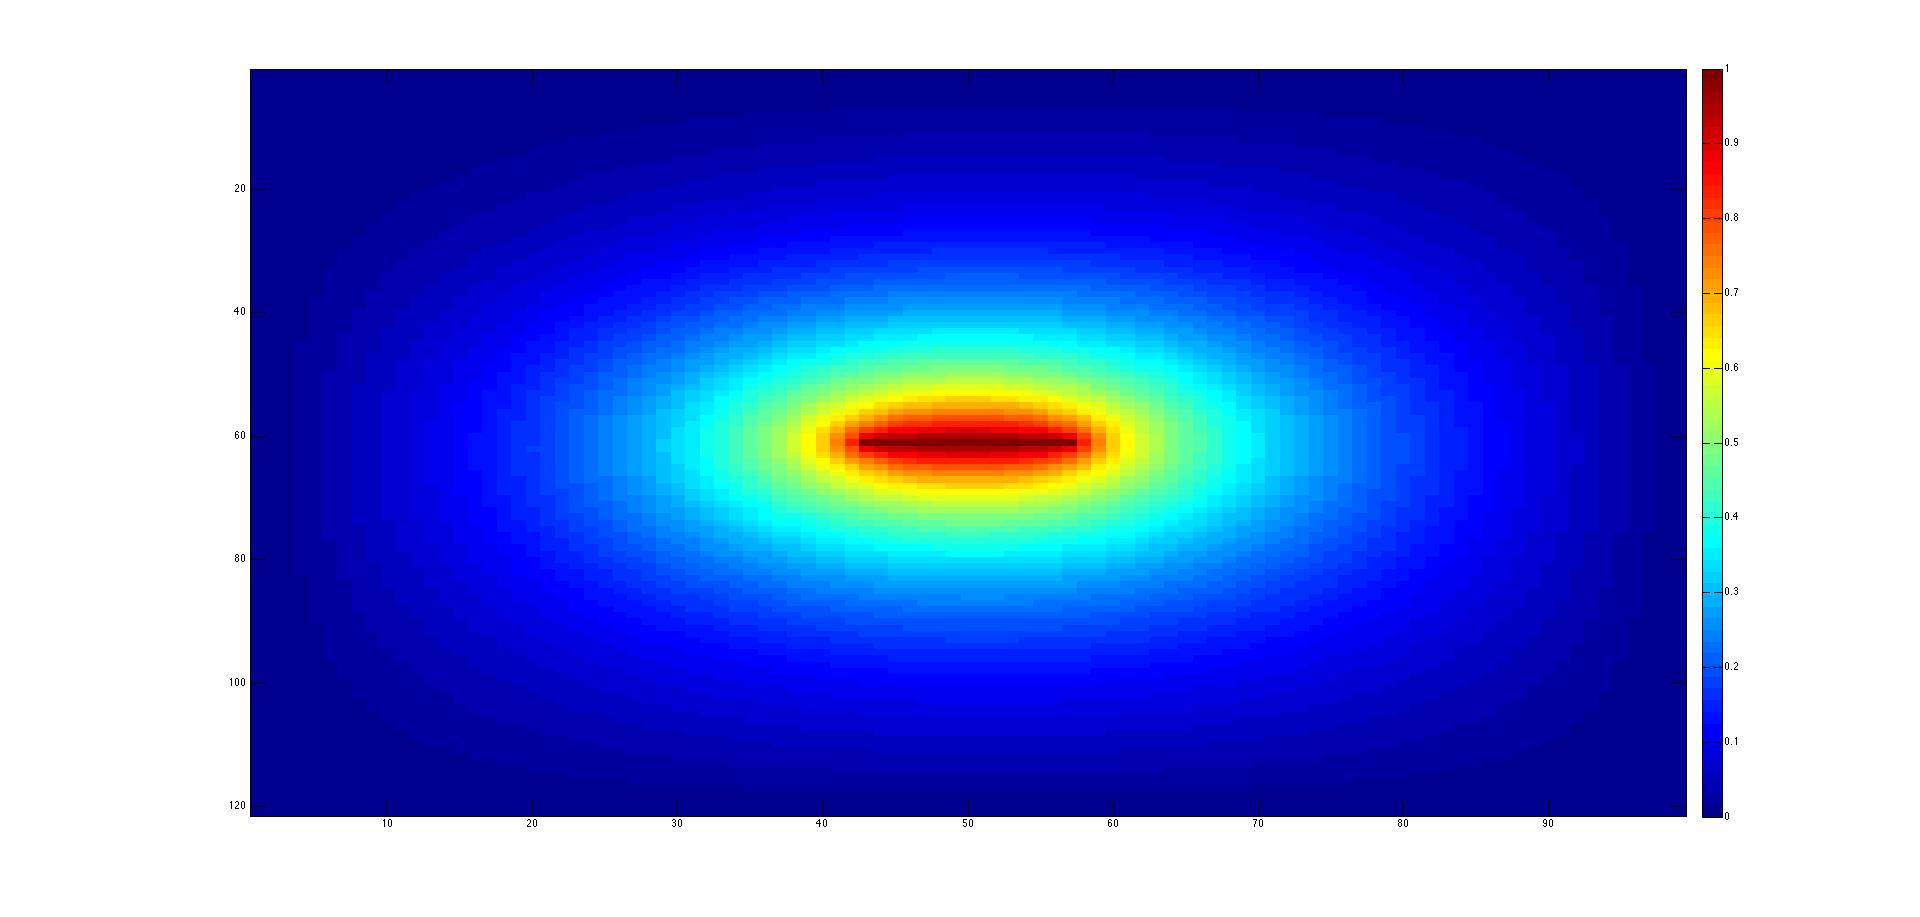
For the plot, you can use the function "contourf".
Example : contourf(your_matrix,100,'linestyle','none')
for a map with 100 color levels
I want to plot the figure from a data file with 3 columns, my data has 3 variables: VarName1, VarName2 & VarName3. My figure must express that VarName3 depends on VarName1 & VarName2. So in this case, what's "your_matrix" of contourf function?
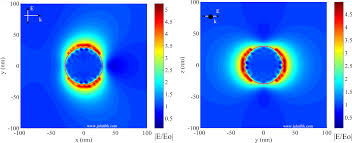
I'll take the example of a radiation pattern of an antenna. So the matrix is 180x360, with theta from 0 to 180 and phi from 0 to 360. I think these are VarName1 and VarName2 ?
So VarName3 is the Gain level of the antenna. The use of the function is the following :
contourf(0:360,0:180,Gain,100,'linestyle','none');