How to plot gm in ADS?
时间:04-08
整理:3721RD
点击:
Hi friends,
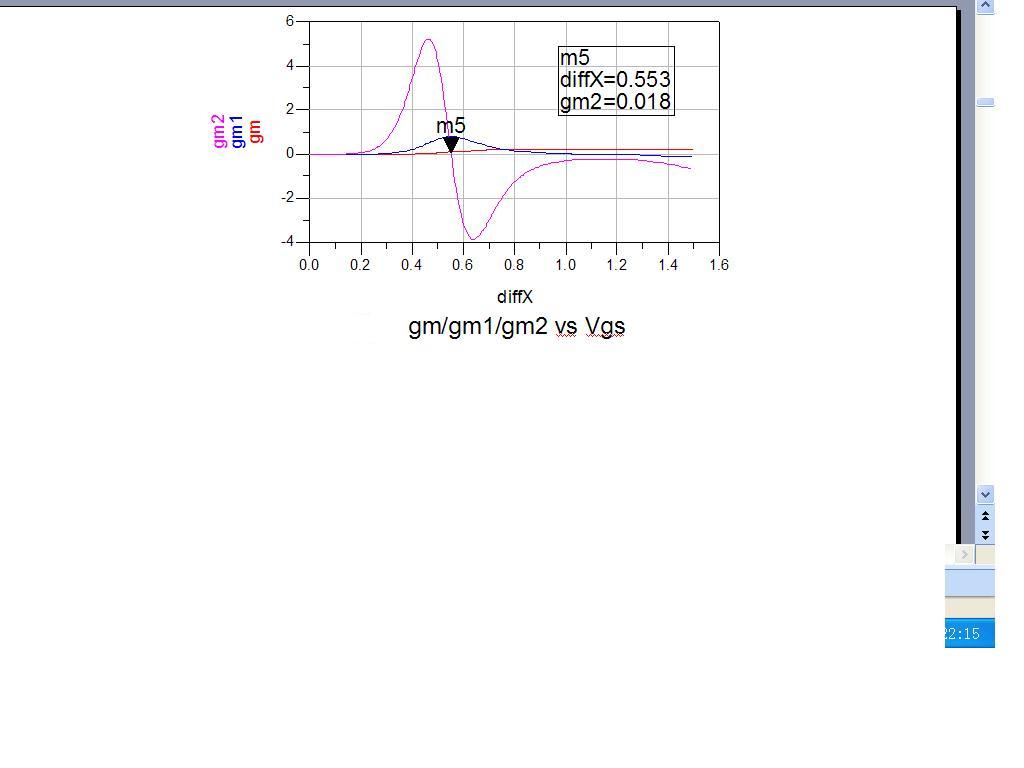
I want to plot Nmos's gm and it's differential coefficient.I got a photo,but i do not how to get them:i do not know what is diffX(I only can find diff() function ) at X-axial and how to plot Y-axial(which equation?).
Anyone can help me?
Thanks,
and select the optimum bias to reduce nolinear.What i can get from the document(no english version) is as above.
I want to plot Nmos's gm and it's differential coefficient.I got a photo,but i do not how to get them:i do not know what is diffX(I only can find diff() function ) at X-axial and how to plot Y-axial(which equation?).
Anyone can help me?
Thanks,
Hi,
If you have only the current and the voltage you need to make a sweep in VGS then only put gm=diff(IDS)
I can help you if you send me more info
thanks
Thanks,eleazar.I want to use ADS to express the function as attached.
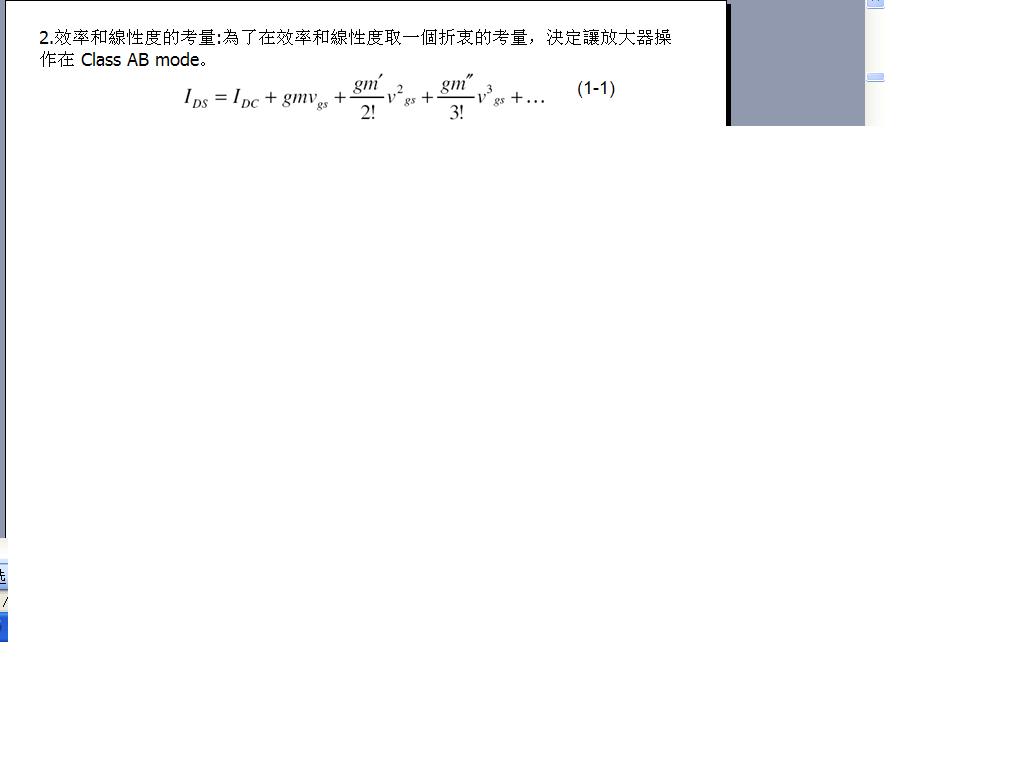
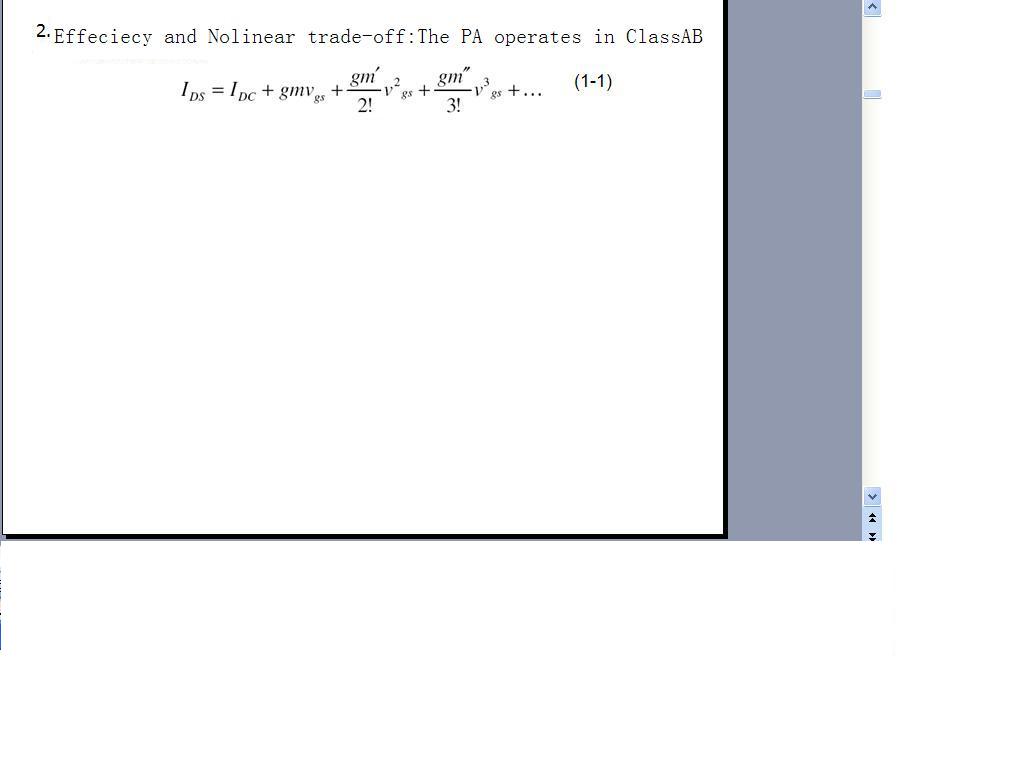
and select the optimum bias to reduce nolinear.What i can get from the document(no english version) is as above.
- How do I plot load pull contours using values from ADS plots (P1_Contours) in excel?
- Real time plotting of radiation pattern using matlab
- Can you plot loadpull contour plots from impedance values ?
- Comparison of two antenna polar plots
- How to plot Pout A1 dB compression point versus frequencies
- How to plot Loadline in cadence spectre