How to plot Q value in Cadence Spectre
时间:04-07
整理:3721RD
点击:
Hi,
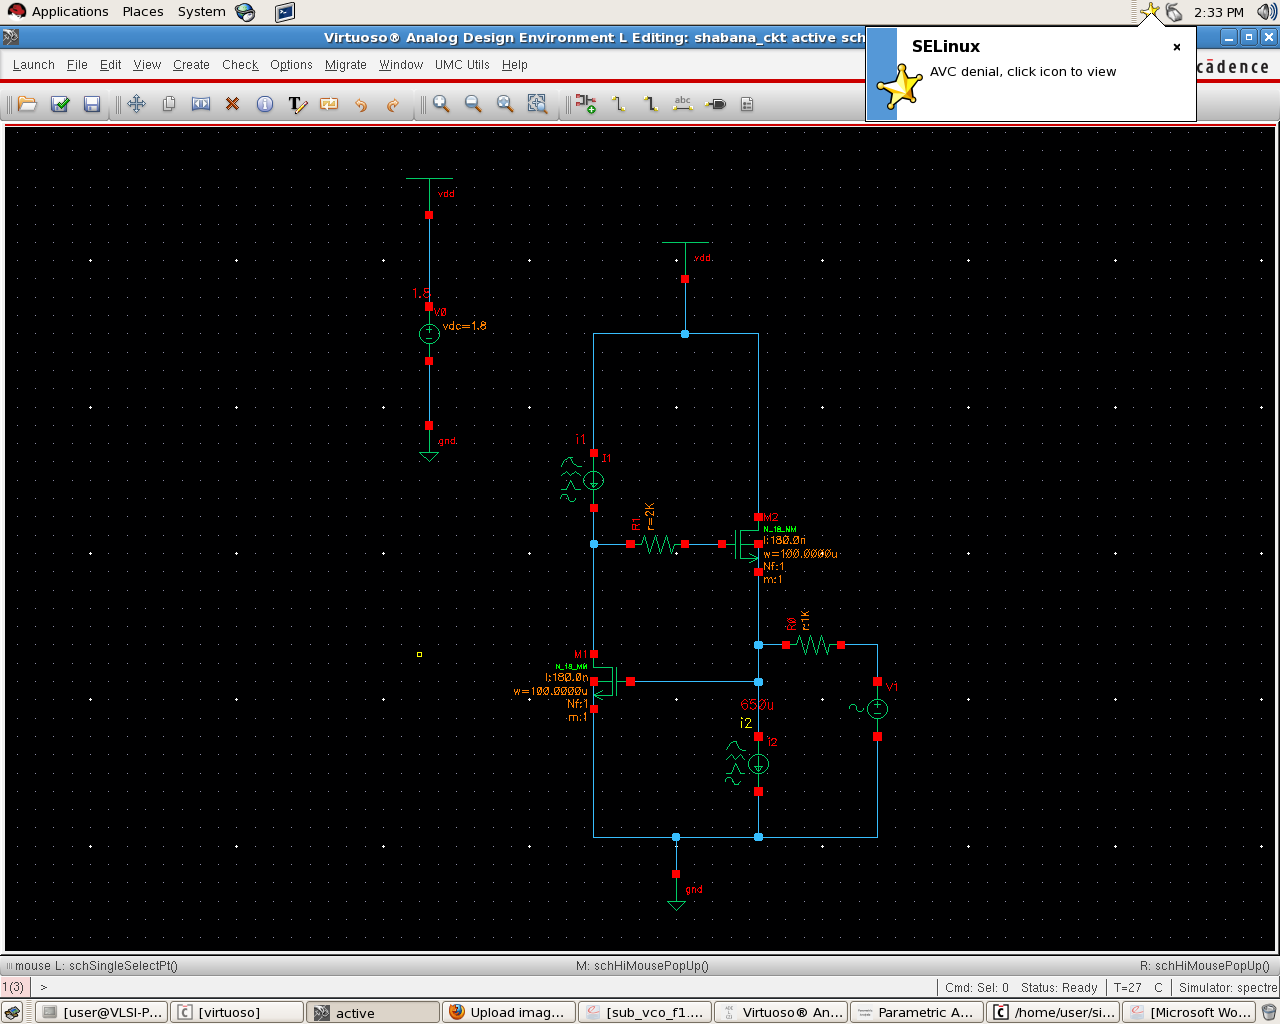
I never did S- parameter analysis and it is required to plot Q vs F for a given circuit.
Attached is the circuit.
Please let me know how to do the same.
None of my seniors or ppl who has done it earlier are here. So, I am dependent on edaboard.
Goggled and browsed edaboard, to do the same, but couldn't succeed.
In desperate need, pls help.
Thanks
- How do I plot load pull contours using values from ADS plots (P1_Contours) in excel?
- Real time plotting of radiation pattern using matlab
- Can you plot loadpull contour plots from impedance values ?
- Comparison of two antenna polar plots
- How to plot Pout A1 dB compression point versus frequencies
- How to plot Loadline in cadence spectre