What are IP3, IIP3 and P1dB ?
The relationship between the three
IP3: Third-order intercept point
The intercept point is a purely mathematical concept, and does not correspond to a practically occurring physical power level. In many cases, it lies beyond the damage threshold of the device.
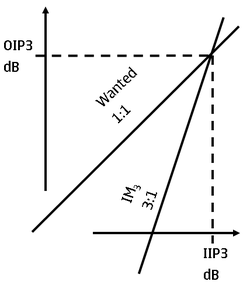
The intercept point is obtained graphically by plotting the output power versus the input power both on logarithmic scales (e.g., decibels). Two curves are drawn; one for the linearly amplified signal at an input tone frequency, one for a nonlinear product. On a logarithmic scale, the function xn translates into a straight line with slope of n. Therefore, the linearly amplified signal will exhibit a slope of 1. A third-order nonlinear product will increase by 3 dB in power when the input power is raised by 1 dB.

Both curves are extended with straight lines of slope 1 and n (3 for a third-order intercept point). The point where the curves intersect is the intercept point. It can be read off from the input or output power axis, leading to input or output intercept point, respectively (IIP3/OIP3). OIP3 = IIP3 + Gain dBm
P1dB: Power at 1 dB Gain Compression Point
For a linear device, output power is merely a fixed fraction of the input power. This includes most passive devices such as connectors, cable, waveguides, etc. Nonlinear devices exhibit complex behavior when input power is compared to output power. However, most nonlinear devices tend to become lossier with increasing input power. Devices such as amplifiers, mixers and switches tend to fall into this category.
At some power level, the gain response of the device will become reduced by a specific amount. This power level is said to be the compression point. Quite often, microwave engineers refer to the one-dB compression point, but two or three dB compression points are often important in power amplifier chains. Thus we refer to the quantities P1dB, P2dB, P3dB. In switches and other passives, you might hear reference to 0.25 dB compression point.
The "classic" way to display power transfer characteristics is to plot the pairs of input and output power data, from linear to nonlinear operation of the device.
The figure below shows an example of the input/output characteristic of an amplifier.The measured output power is plotted against the ideal linear response. Where these two lines diverge by one dB is noted as the P1dB point.

It can be read off from the input or output power axis, leading to input or output 1dB compression point, respectively (IP1dB/OP1dB). OP1dB = IP1dB + (Gain - 1) dBm
If you want your system to "act linearly", you need to stay well below the 1dB compression point. This can lead to serious inefficiency, for example, you might need to use a 10 watt amp backed off to one watt output power.
Relationship between P1dB and IP3.
In many books and articles, the relationship between 1dB compression points and third order intercept points is IIP3 9.6dB higher than IP1dB and OIP3 10.6dB higher than OP1dB.
But, In fact, There is no exact analytical relationship between P1dB and IP3.
As a rule-of-thumb (typical behavior):
P1dB is about 10 dB lower than IP3 for a microwave RF amplifier.
P1dB is about 15 dB lower than IP3 for VHF and HF amplifiers.
Look at pg 7 and 8 for theoretical derivation:
http://www.designers-guide.org/Analy...cept-point.pdf
