finding and plotting E and H planes from an analytical expression
时间:04-07
整理:3721RD
点击:
Hi, I would like to clarify my ideas on E and H plane of an antenna starting from an analytical expression of eletric filed.
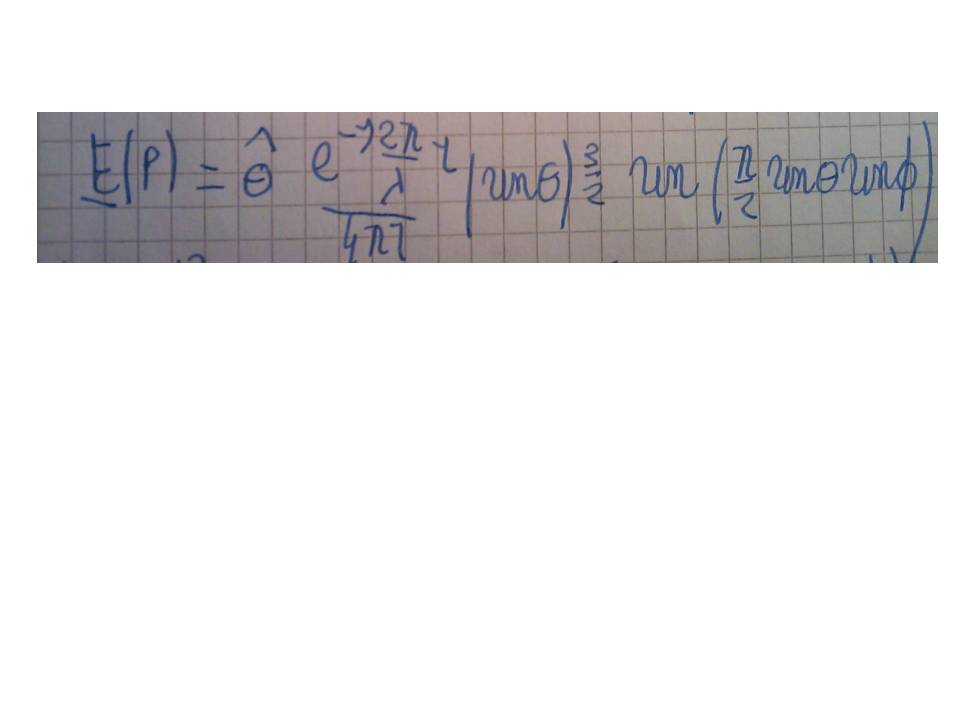
For example I am looking to E and H planes starting from the following expression which represents the electric field of a dipole over ground plane oriented along the z axis (the ground plane il parallel to the z axis) The field expression is in the image attached to the post
where θ^ is the unitary vector.
The E plane should contain the direction of maximum radiation that is the zy plane (the maximum of the electric field is for theta=0.5*pi and phi=0.5*pi. The H plane is perpendicular to the E plane (xy plane) Is it correct or wrong?
How to plot the expression for example using Matlab? I wrote the following code but I am not sure
theta=0:0.01*pi:pi;
phi=0:0.01*pi:pi;% because of the ground plane
E=((sin(theta)).^1.5).*(sin(0.5*pi*sin(theta)));%p hi=0.5*pi
e=abs(E);
H=sin((0.5*pi*sin(phi)));
h=abs(H);
subplot(2,1,1)
polar(theta,e);
title('E plane');
subplot(2,1,2)
polar(phi,h);
title('H plane');
Thanks, Gabriele
- Real time plotting of radiation pattern using matlab
- Plotting Imag(Y11+Y12) in Cadence Virtuoso/Spectre
- Plotting total vector current(conduction + displacement) in HFSS
- S parameters plotting with cst
- plotting phase trajectory, evm, acpr
- Mathcad help metamaterial in plotting curve between -ve permeability and frequency