teach me how to plot the gainv/s frequency
时间:04-06
整理:3721RD
点击:
Hello I am Mehrdad. I have attached one paper and design. my s(1,1) parameters has been matched but i dont know how to plot the gain v/s freq. so please can anybody teach me how to plot the graph of gain v/s frequency so that i can telly my results with the paper.
I dont know how to set the value of Theta and phi.
Regards
Mehrdad
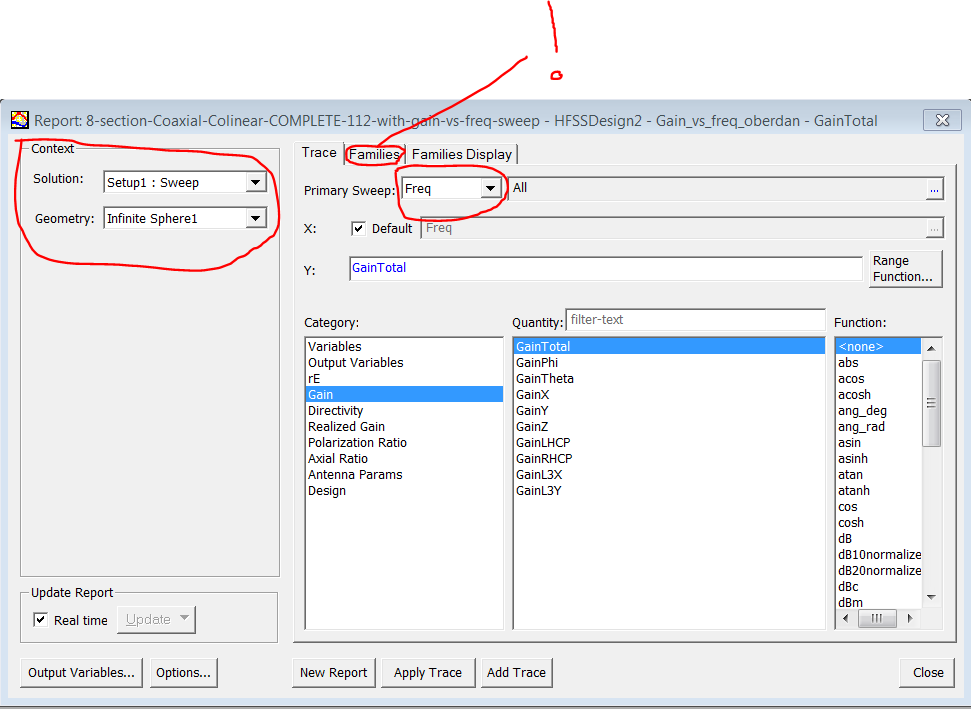
I corrected the file you sent me by adding the definition of the plot for the "gain versus freq". Please find it listed in results in the project manager tree.
Far field properties by default are assigned to be plotted for the last adaptive pass. what I did was to switch to freq sweep instead. Please see enclosed picture.
Please do not forget to go into the "families" tab and select the observation angle on which plot the gain.
Hope this help
Regards
Note how he set the solution to "setup1: sweep" - I no longer have access to HFSS, but I know the default would have the word "interpolating" in it. IIRC, you need to change the solution to "setup1: sweep" before tyring to change the x plot to "freq". Once you have done that, do as he says and pick a value for theta and phi for which you want to plot the gain vs frequency. Otherwise I expect you will have hundreds of graphs (one for each combination of theta and phi), and will not meaningful to you.
Dave
I dont know how to set the value of Theta and phi.
Regards
Mehrdad
It would be better if you stated what software you were using. However, since you had a problem with the exact same thing I once had a problem with, I guessed it woud be HFSS. An inspection of your rar file showed that is indeed the case. But in future, state what software you are using.
You need to use either 'fast' or 'discrete' frequency sweep - an 'interpolating' sweep is not suitable. The rest I will simply copy and past from an email sent to my by an Ansys engineer, when I asked him how to do it. That in italics is from an Ansys engineer. I think with the words he wrote, and the diagram he sent, you can work it out.

I corrected the file you sent me by adding the definition of the plot for the "gain versus freq". Please find it listed in results in the project manager tree.
Far field properties by default are assigned to be plotted for the last adaptive pass. what I did was to switch to freq sweep instead. Please see enclosed picture.
Please do not forget to go into the "families" tab and select the observation angle on which plot the gain.
Hope this help
Regards
Note how he set the solution to "setup1: sweep" - I no longer have access to HFSS, but I know the default would have the word "interpolating" in it. IIRC, you need to change the solution to "setup1: sweep" before tyring to change the x plot to "freq". Once you have done that, do as he says and pick a value for theta and phi for which you want to plot the gain vs frequency. Otherwise I expect you will have hundreds of graphs (one for each combination of theta and phi), and will not meaningful to you.
Dave
- How do I plot load pull contours using values from ADS plots (P1_Contours) in excel?
- Real time plotting of radiation pattern using matlab
- Can you plot loadpull contour plots from impedance values ?
- Comparison of two antenna polar plots
- How to plot Pout A1 dB compression point versus frequencies
- How to plot Loadline in cadence spectre
