plot the curve of Cgs vs Vgs in Cadence
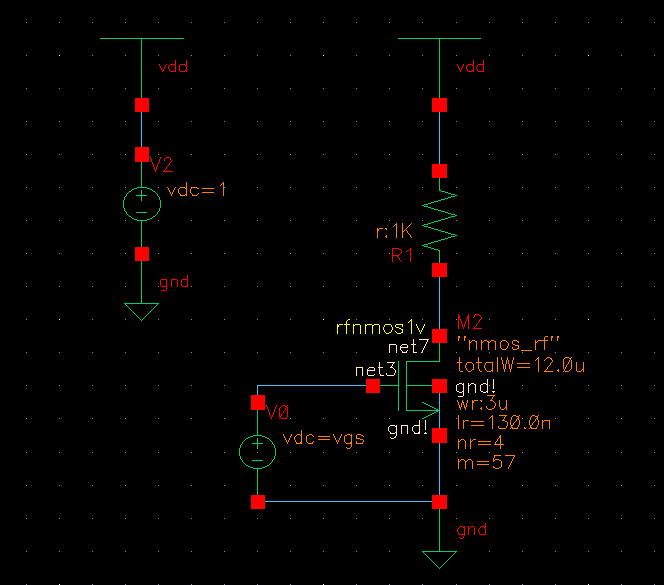
I want to check if the gate-source capacitance Cgs depends on bias voltage Vgs or not. I set up the circuit for simulation in Cadence as below.
Could you tell me how can I plot the curve of Cgs vs Vgs.
Thanks.
Hi,
Follow the steps listed here :http://www.32mosfets.com/cadence/cad...t-gm-and-gmid/
Everything until step 6 will be similar. Then choose Cgs and if you sweep VGS, you'll have your plot. Credits go to the writer.
Natnoraa
Hi, thanks. I followed that procedure. However, in the step 3. I don't see there is such options.
3. now click ADE -> options -> select waveform tools : AWD
Hi,
try this: in your ADE window, select setup and then model libraries. attach the .scs file from there (for that step)
Natnoraa
Hi.
I completed step 5 and got the Results Browser as bellow.
However, I don't understand step 6. It says something like this "Right click Cgs and get the Cgs plot".
Where is Cgs to click on?
Please tell me how to proceed? Thanks.

Hi,
Sorry for the late reply. Is it in dcOp-dc or dcOpinfo-info? Find the transistor and you can plot all the dc related parameters
Natnoraa
Thank you.
I used DC analysis and it is in dc-dc. Now I can plot a lot of internal parameters that I always got stuck.
Hi,
Don't mention it. I had the same problem when i first started out. Glad I could be of some help.
Natnoraa