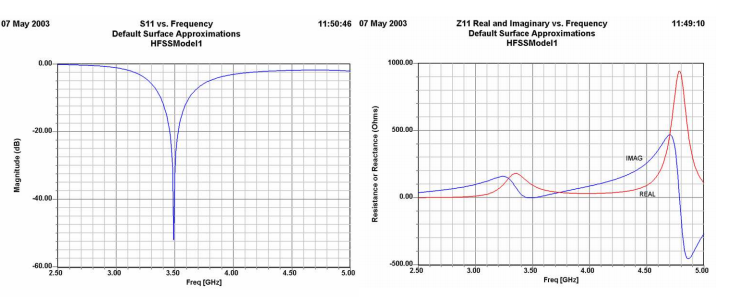
how to plot Z11 parameter
I hope everything will be fine. Somebody can help me? Do you have any idea how to realize the Z11 curve in HFSS
with its real and imaginary part as indicated in this image right above.
thank you in advance

Howdy,
I assume you already have a simulation that you have successfully ran, including some excitation port.
Go to the project manager window on the left side of the screen. Click on your current design and expand it. Right click on the RESULTS section >> Create Modal Solutions Data Report >> Create Rectangular Plot. Under Category you can select the Z parameters, and under function you can select real and imaginary. Alternatively, you can just type in "im(Z(1,1))" or "re(Z(1,1))" to the Y category. Click "New Trace" the first time you do it, then double click the graph you just made and click "add trace" if you want to plot real and imaginary impedances simultaneously.
Does that answer your question?
Hello Kthackst, yes thank you i try and it works.
Thank you very much :)
- How do I plot load pull contours using values from ADS plots (P1_Contours) in excel?
- Real time plotting of radiation pattern using matlab
- Can you plot loadpull contour plots from impedance values ?
- Comparison of two antenna polar plots
- How to plot Pout A1 dB compression point versus frequencies
- How to plot Loadline in cadence spectre
