The problem of measuring the ASK eye diagram of a 5.8GHz transmitter
256/512K random sequence generator---Gaussian filter---LPF(filter the clock signal)---5.8GHz ASK modulator(double-balance mixer)---PA
Now we use Agilent N9020A with 89600 vector signal analysis software to measure the eye diagram of the output, the I/Q waveform seems pretty good, but the eye diagram seems a mess. Instead of a single line, the star map looks like a sector, indicating there is phase modulation at the same time which is very confusing. What's the reason about this?
Besides, as the modulated 5.8GHz waveform of the output seem pretty good on the oscilloscope too, could we use the oscilloscope to measure the eye diagram? How?
Does the eye diagram seem good before your PA? AM-PM conversion is common problem with power amplifiers. How close to saturation are you operating the PA?
1) use PLL clock or clock /N to trigger data on scope for eye pattern
2) compare tx clock to rx clock jitter.
Sorry, we didn't reserve a PIN for test before PA. Besides, the PA output is differential but we just use a single-end. Does this affect the result?
---------- Post added at 20:25 ---------- Previous post was at 20:16 ----------
The problem is the signal displayed on the oscilloscope is modulated 5.8GHz ASK signal with 256/512Kbps symbol rate. How does the oscilloscope demodulate the signal?
If you want to see eye diagram, you need to design/build/use a discriminator. That is the purpose of this test to see how much phase/amplitude distortion is in recovered signal.
Integrated design solution is a PD5000 from Phychips.
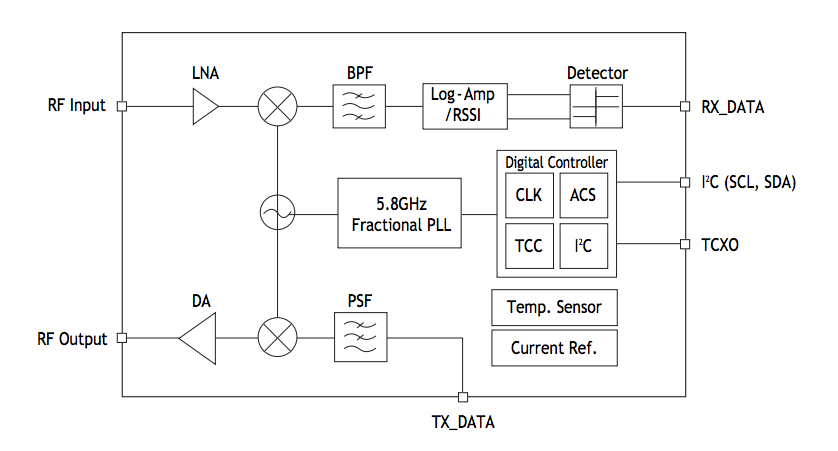
This uses LNA, PBF, mixer, fraction N synth Osc, AGC using RSSI dc level to control Log Amp, or you could use a primitive pin diode with poor performance.
or search for other solutions
http://www.phychips.com/new/products...(1%20page).pdf
If your source has poor ground or drive level. Test with low frequency 1st and find where noise is generated.
You don't specify how you get from differential to single ended, I assume you used a balun?
One way to determine if the PA is the cause is to back off the power going into the PA and see if the eye diagram looks better. If you have gain control, try backing off 10 dB and see if that improves the eye diagram.
The output wasn't transformed from differential to single ended. One of the differential output is connected to SMA interface directly. Is this not appropriate?
You're terminating the unused line with 50 ohms right?
Have you run the test yet where you reduce the power into the PA by 10 dB?