Radiation Intensity of Antenna
Hello,every one
I am trying to plot radiation intensity of antenna using the following code but it is giving me an error. please, help me
PI = 4.0*atan(1.0);
E = 120.0*PI;
L=1;
Io = 1;
r=2;
k=2*pi;
THETA=0:1:359;
polar(THETA,(((cos(k/2*L*cos(THETA*pi/180))-cos(k/2*L))/sin(THETA*pi/180))^2*(E*Io^2/(8.0*PI^2))),'--r');
and the error is given below
Error using polar (line 61)
THETA and RHO must be the same size.
Error in Q1 (line 19)
polar(THETA,(((cos(k/2*L*cos(THETA*pi/180))-cos(k/2*L))/sin(THETA*pi/180))^2*(E*Io^2/(8.0*PI^2))),'--r');
- - - Updated - - -
i resolved the problem but i am not getting polar plots in degree co-orditanates. can any body please help me . I have attached the graph and here is my code.
PI = 4.0*atan(1.0);
E = 120.0*PI;
L=1/4;
A = L*PI;
Io = 1;
r=2;
k=2*pi;
THETA=0:0.01:2*pi;
U =((cos(k/2*L.*cos(THETA))-cos(k/2*L))./sin(THETA)).^2*(E./(8.0*PI^2));
polar(THETA,U);
Append these lines to your code.
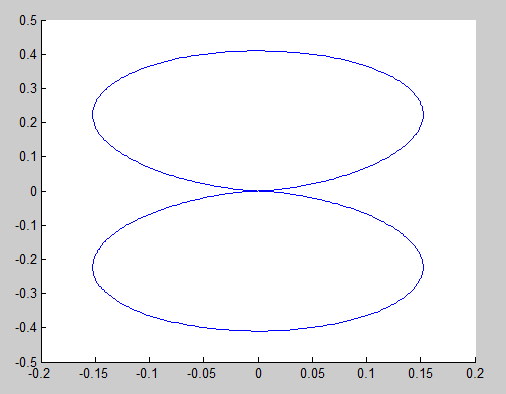
[X,Y] = pol2cart(THETA,U);
plot(X,Y)
axis([-0.5 0.5 -0.5 0.5])
still i am not getting correct result. i wanna graphs with axis shown in figure below.
Then ignore my previous post
Normalize your U and then polar plot in dB i.e., plot 10*log10(U)
- - - Updated - - -
thanks for prompt reply...
what do you mean by normalize ?
U = U/max(U);
plot this first and see. before trying to change to dB.
thank you very much, you solved my problem;
how can I get 3 d plot(see attachment) for the same equations ?
I have added a few lines of code in the MATLAB program to rotate the 2D curve into a 3D object.
The entire code is below. I have adjusted the number of points in THETA and the repmat to be the same.
PI = 4.0*atan(1.0);
E = 120.0*PI;
L=1/4;
A = L*PI;
Io = 1;
r=2;
k=2*pi;
THETA=0:0.1:2*pi;
U =((cos(k/2*L.*cos(THETA))-cos(k/2*L))./sin(THETA)).^2*(E./(8.0*PI^2));
U = U/max(U);
[X,Y] = pol2cart(THETA,U);
xr = X.'*cos(THETA);
zr = X.'*sin(THETA);
yr = repmat(Y.',1,63);
surf(xr,zr,yr)
axis equal
but at L=1.25 it should produce graph like the one I mentioned in attachement.
The graph you show (from the Balanis book) is in dB scale. Your equations are all in a linear scale.
The code I gave generates the correct shape of the lobe in the linear scale (based on your original equations).
If you want your result to look like the picture you posted, you have to convert to dB. It is not that straight forward in a polar plot, due to the nulls (log(x) approaches infinity as x approaches 0).
See [ http://www.mathworks.com/matlabcentr..._thread/154001 ]. I think that this file: [ http://www.mathworks.com/matlabcentr...ent/polar_dB.m ] might perform a good conversion to dB scale, which you then plot.
Radiation Intensity Antenna 相关文章:
- Radiation pattern of an inverted F antenna IFA
- Real time plotting of radiation pattern using matlab
- Spurious radiation and surface waves in MSP Antenna
- Antenna Radiation pattern multi-lobed and directional with increase in ground plane!
- Improving radiation performance by using a mutual coupled antenna
- Radiation Pattern Check