Impedance Measurement of Coaxial Cable
I have a Wiltron 37269A Vector Network Analyzer (w/ Time Domain capabilities).
The DUT is a cable that has one connector at each end (SMA typically) and can vary in length from a few inches to several feet. Typically we plot S11 (VSWR) and insertion loss (S21) over a certain frequency range (e.g., 0.4 to 6 GHz) and make sure the VSWR and loss are within a certain limit.
I'd like to be able to measure the impedance of these cable. For example, the characteristic impedance is 50 Ohms. I'd like to know if we stay within 50.0 +/-1.0 Ohms throughout the cable. Ideally, using the Time Domain I would be able to examine the impedance throughout the length of the cable and possibly identify any faults.
Any help would be greatly appreciated. My background is in Mechanical Engineering so my knowledge of RF/Microwave measurements is not great.
So you can measure the cable section as any two-port. S11 and S22 will indicate any impedance deviations from 50 Ohms of the VNA, also including connectors.
Coaxial cable manufacturers often give impedance and loss data over frequency, and testing methods. TDR is best for connector testing.
A frequency domain measurement, e.g. S11 of the 50 ohm terminated cable can be converted to time domain to get a simulated TDR measurement. Some newer VNA intsruments provide the feature as a software option.
It's relative simple in case of a constant impedance variation. You get a circle around the origin in Smith chart and can calculate the Z0 deviation from the radius respectively measured VSWR. It's also common to specify cable performance as VSWR number over a specified frequency range.
Conversion to time/position resolved impedance uses fourier transform and is a bit more involved.
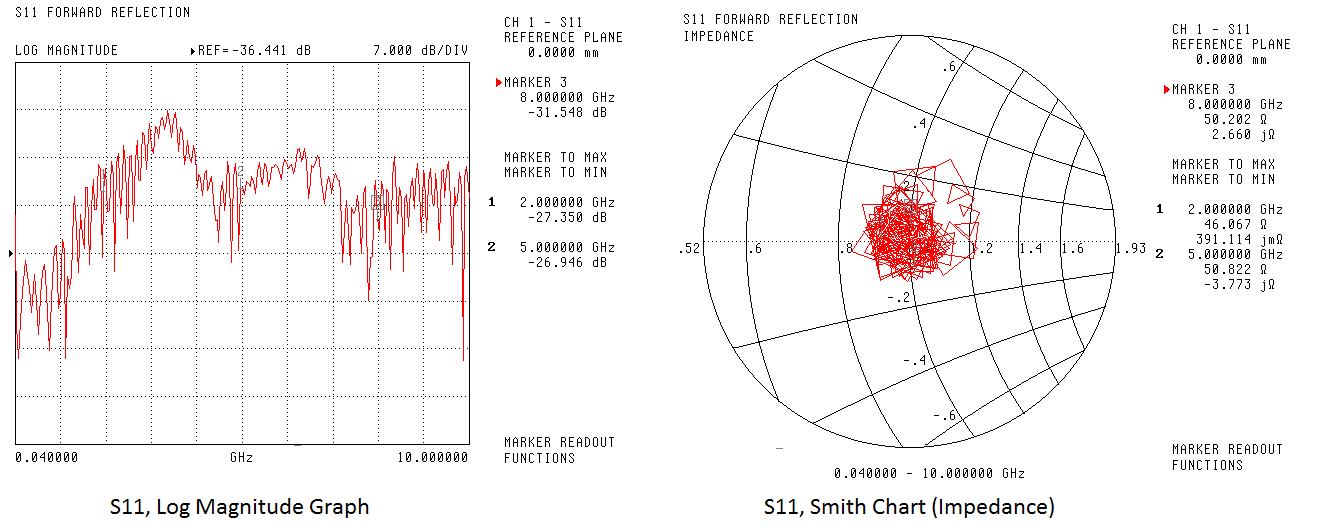
Ok. So in the attached picture I have two graphs with markers at 2, 5, and 8 GHz plotting S11. One has the graph type set to Log Magnitude and the other has the graph type type to set to Smith Chart.
I think the log mag. graph doesn't tell me much. So in the Smith Chart, for example, at 5 GHz (marker 2) I see 50.822 -3.773j Ohms. I understand this is the real and imaginary part of the impedance. So can I simply take the magnitude of this value and say the impedance is 50.96 ohms?

https://www.youtube.com/watch?v=Il_eju4D_TM
https://www.youtube.com/watch?v=TpIIftvQPFM
No. A single point in Smith chart can't be related to cable impedance.
The Smith chart looks rather chaotic. Either a long cable with too few sweep points or an inaccurate measurement. I would first try if more points or averaging give a smooth curve.
Your plots should be much smoother than that. Are you using a logarithmic frequency sweep?
You could be interested to the article: "Make Quick Work Of Impedance Measurements" you can find in the pdf file at this URL:
preview.insidepenton.com/microwaves/MRF110101_DE.pdf
Unfortunately some picture taken from the VNA has been badly printed, however the method should be easy to understand
Ok - I will try adjusting the adjusting the number of data points or averaging (I know the VNA has an averaging feature).
However, I'm still not clear how I measure the impedance of this cable. I think my questions are:
- Which S-parameter should I be set on for the channel? I believe this is S11, forward reflection.
- What graph type should be I be using to most easily measure impedance? My options are log magnitude, phase, log magnitude and phase, smith chart, SWR, group delay, power out, smith chart (admittance), linear polar, log polar, linear mag, linear mag and phase, real, imaginary, real and imaginary.
I'll only consider the frequency phase for now. I think the time domain will only further complicate it for me at this point.
So once I'm looking at this graph, how do I get the impedance?
Thanks in advance for your patience.
Impedances are easiest visualized in the Smith chart
but
the network analyzers do not measure/show the cable impedance. What you see is the input impedance at the measurement port, which depends on cable impedance and frequency. Here's the math:

Only when cable impedance = load impedance, you will measure a constant value at all frequencies.
As FvM described above, you will see a circle in the Smith chart when the cable is some wavelengths long, and the "centre" of that circle can be used to read the line (cable) impedance. In your case, it is nicely centered at 50 Ohm (center of Smith chart) so your cable is very close to 50 Ohm.
I think you can have a look to "Make Quick Work Of Impedance Measurements" as per my previous post. There is described how to measure the impedance of a cable using a VNA (from the S11 measurement).
First of all, you can not measure only cable impedance. You can measure it with a termination. Your measurement device gives you an almost perfect 50ohm. You will use this cable for 50ohm devices. Therefore, the impedance you measured is useful for that cable. You can use that s parameter in a simulation tool easily.
If you increase the sample point for smith chart, you can have a better graph.
Measurement Impedance Cable 相关文章:
