[ASK] Help me measure this graph
К±јдЈє04-04
ХыАнЈє3721RD
µг»чЈє
Hello everyone,
I need help to learn the existing graph below :
Figure 1
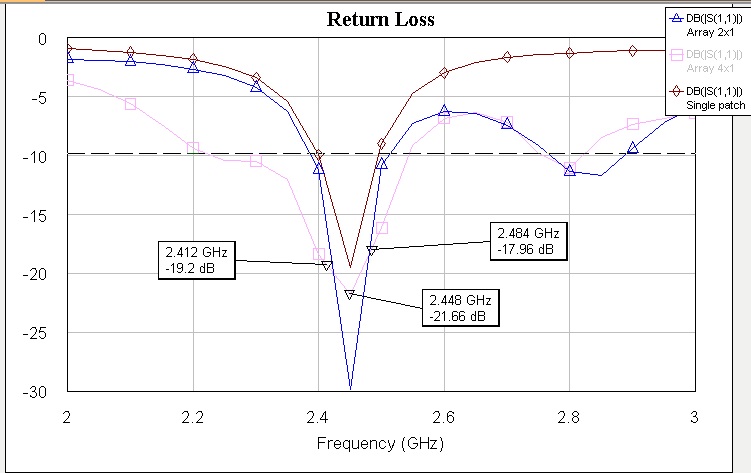
Figure 2
and what answer for this ?
1. Why on the third draft of the array 4x1 has a different shape compared to the array of 2x1 or single element?
2. Why is the design of the 2x1 has the value return loss larger around-32 db compared to the draft 4x1?
should be on the design of the 4x1 has a power greater than 2x1.
Please help me answer the 2 questions above. If I can beg to be given references about an array of antenna theory. Thank you very much for the help.
Greetings
I need help to learn the existing graph below :
Figure 1
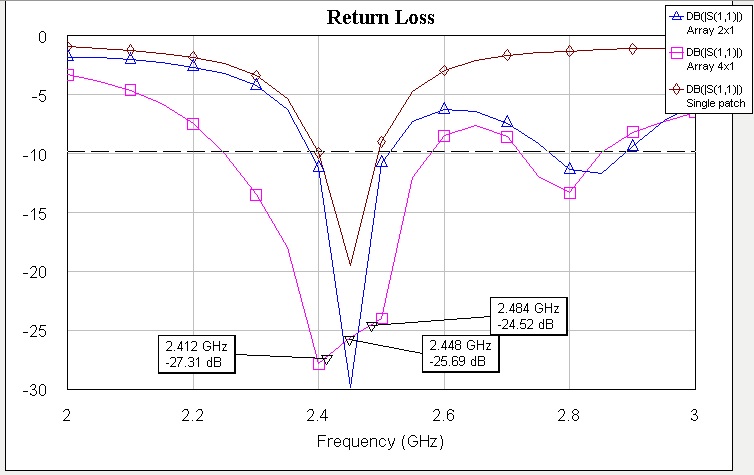
Figure 2
and what answer for this ?
1. Why on the third draft of the array 4x1 has a different shape compared to the array of 2x1 or single element?
2. Why is the design of the 2x1 has the value return loss larger around-32 db compared to the draft 4x1?
should be on the design of the 4x1 has a power greater than 2x1.
Please help me answer the 2 questions above. If I can beg to be given references about an array of antenna theory. Thank you very much for the help.
Greetings
Seeing different return loss numbers only means that the antennas have slightly different input impedance. The image might change completely with small variations of the matching network.
The most significant information is that the 4x1 array has larger bandwidth.
ЙПТ»ЖЄЈєMicrowave signal transition between PCBs. SIW, castellation RF modules above 2.4 GHz
ПВТ»ЖЄЈєЧоєуТ»Ті
ПВТ»ЖЄЈєЧоєуТ»Ті
- How do I know if a spectrum analyzer is enough to measure an specficic DAC?
- Using ADS2019, How to set and measure tempature values for LNA?
- H field measurements with waveguide twist
- How can I measure the Side-Band Amplitude?
- Keysight PNA Harmonics measurements
- frequency shift between simulation and measurements