How to check the model of varactor diode in ADS
I am trying to create model of SMV1247 - SC79 varactor diode in ADS, but I do not know whether the model that I create is correct or wrong. So, I think I must know how to measure parameters of model in ADS before, and I am trying to do it with BBY51-SOT23 varactor diode model that is a element of HFDiode_vendor_kit that is supplied by ADS (http://www.eas.uccs.edu/~mwickert/ec...DS_Library.pdf). I have read datasheet of BBY51, and I just see the curve describing the relationship between Capacitance and Reverse Voltage.
Could you show me how to measure the model of BBY51-SOT23 in ADS in order to ensure that this model is corresponding to BBY51 described in datasheet?
Thanks in advance.
Dear KisuLom,
For check the varactor's model in ADS, you need to do a S-Parameters simulation. Do this: On S-Parameters config adjust your frequency range and on Parameters tab, select Y-parameters. On your terminal, put on "VDC" parameter one variable. So put one "Parameter Sweep" box and put the VDC variable, e.g. "vdc", to be swept. On tab Simulations, set SP1 on Simulation 1 box. Then run your simulation.
On your Data Display Window, put the following equations:
1) Y11imag=imag(Y(1,1))
2) Y11imag_deriv=diff(Y11imag)
3) C = Y11imag_deriv/2/pi
Then plot your capacitance vs. vdc: plot_vs(C[::,0], vdc)
Where:
:: = all frequencies
0 = correspond to step-size of VDC variable. Example: 0 to 5V with 21 step-size (0.25V of step-size). Then this one will range from 0 to 20.
I made this process on another varactor (SMV1237) and the results are okay.
Best regards,
Eduardo.
Hi Eduardo, thanks for your help. I follow your way, but results are not what I desired. I noticed that the characteristic of BBY-51 is changed when I choose the diffirent ranges of frequency. Fig1 is corresponding to frequency range from 1.0GHz to 2.0GHz. Fig2 is corresponding to frequency range from 2.0GHz to 2.8GHz. Could you help me check my simulation [Fig.3] and try changing frequency ranges in your simulation in order to see whether characteristics of your SMV1237 model is changed according to ranges of frequency.
Thank you so much.
Hi,
Try to connect the other diode on the Gnd too. I think that if you leave disconnected maybe it causes problems.
The fact of capacitance changes according to frequency range is correct. But the results of second range (2.0Ghz to 2.8Ghz) is very strange. Try to put the same configurations as it is showing in datasheet (http://www.mouser.com/ds/2/196/bby51series-89159.pdf). At page 3, one graphic shows the capacitance (Ct) vs. voltage (Vr) at 1Mhz. For validate your design you need to obtain the same result.
Regards,
Edurdo.
Hi again,


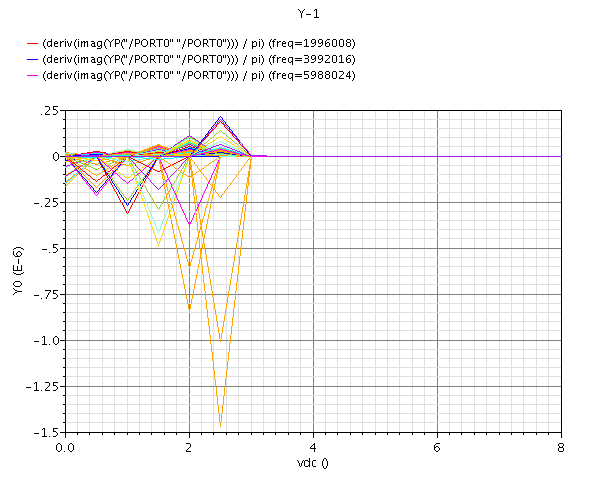
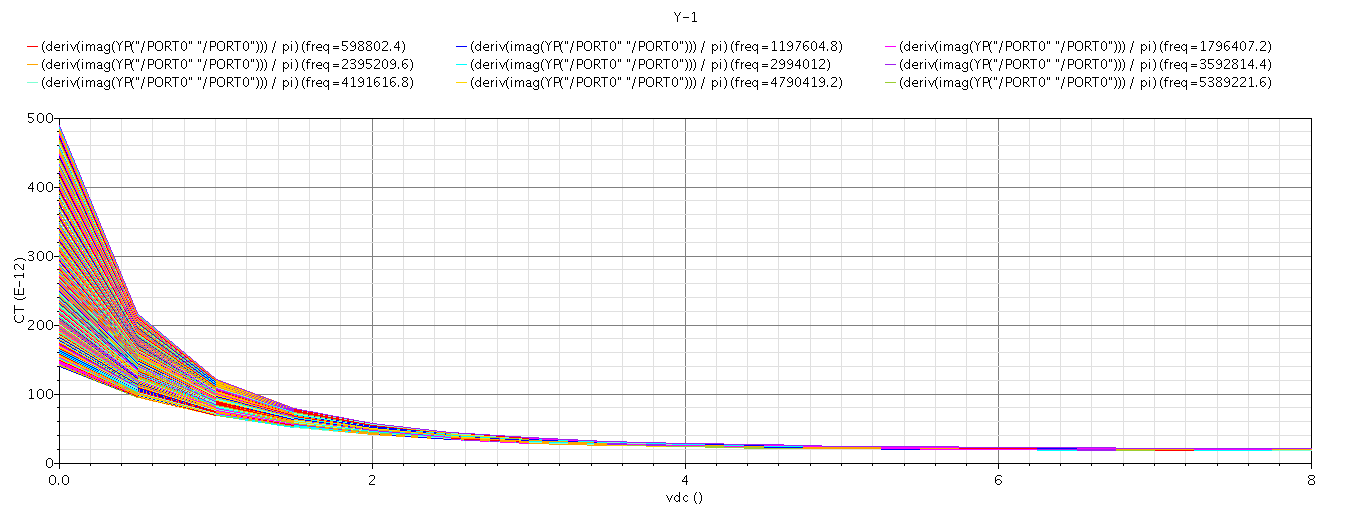
Look my two graphics (They were designed on Cadence Virtuoso, but the equations were same). The first one has an exponential decay and with the frequency increase at the initial range of VDC (around 0 to 2V) the capacitance changes, varying from around 100pF to 500pF. In my case, this is correct. The frequency range was from 0 to 300MHz.
The second one has an error. Its similar to your when your frequency range was among 2GHz to 2.8Ghz. In the fact, I think that its occurs because the numerical derivative. In my case, the frequency range was from 0 to 1GHz.
Regards,
Eduardo.
