Re: Measuring the delay spread with a network analyzer.
时间:04-04
整理:3721RD
点击:
Here is my octave code to calculate the delay spread.
Code:
# IFFT for measuring the delay spread inside the shielded room
# open the file than contains amplitude (in dB) and phase information (degree) information
# COnvert this into complex data.
# Take an inverse fourier transfrom
# Compensate for windowing as the measurements were done on a a limited frequency band
# Power delay profile is square of absolute value of the IFFT
# open a file
from math import cos,sin
import cmath
import numpy as np
import matplotlib.pyplot as plt
import math
y1=[]
y2=[]
y3=[]
Z=[]
data=[]
t=[]
i=0
h1=[]
h2=[]
h3=[]
sum_n=0
sum_n_2=0
sum_d=0
#fid=open('open_office.CSV','r')
fid=open('pos1_shielded_room.CSV')
for line in fid:
#line.readline()
a1=line.find(',',0)
y1.append(float(line[0:a1-1]))
#print y1
a2=line.find(',',a1+1,len(line))
y2.append(float(line[a1+1:a2-1]))
#print y2
y3.append(float(line[a2+1:]))
#print y3
L=1601
start=1
stop=start+L-1
span = math.pow(10,-6)/100
print span
step=span/L
#print step
# Hanning window
W=np.hanning(L)
for i in range (0,len(y1)):
data.append(cmath.rect(math.pow(y2[i]/10,10),y3[i]))
#print data[i]
for i in range(0,L):
t.append(step*i)
h=np.fft.ifft(data*W)
#h=h[1:L/2]
for i in range(0,L):
h1.append(abs(h[i]))
h2.append(math.pow(h1[i],2))
h3.append(10*math.log(float(h2[i]),10))
#print h1
# Mean calcuation
for i in range(0,L):
sum_n=sum_n+t[i]*h2[i]
sum_n_2= sum_n_2 + math.pow(t[i],2)*h2[i]
sum_d=sum_d+h2[i]
t_mean=(sum_n/sum_d)
t_rms=math.pow(((sum_n_2)/(sum_d)- math.pow(t_mean,2)),0.5)
print ("\n Mean delay spread[nsec] %f \n") %(t_mean*math.pow(10,9));
print ("\n RMS delay spread[nsec] %f \n") %(t_rms*math.pow(10,9));
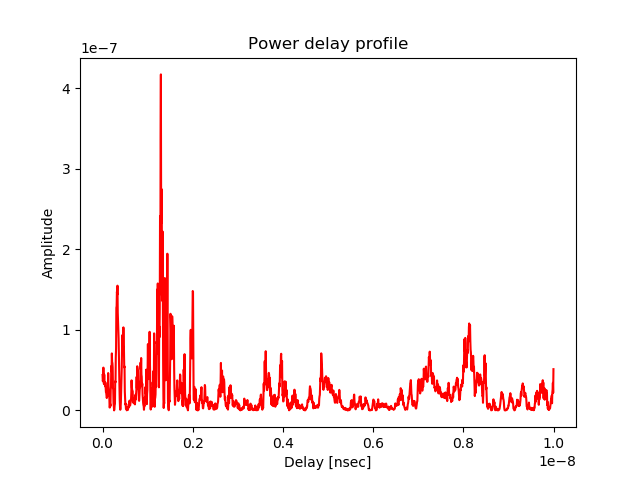
plt.subplot(111)
plt.plot(t,h2,'r')
plt.title('Power delay profile')
plt.xlabel('Delay [nsec]')
plt.ylabel('Amplitude')
plt.show()