Drawing simple Data in Smith ADS smith Chart
I want to plot simple array of data in ADS smith Chart ( On display page , I\m not talking about ADS smith Chart utility).
Consider my load to be an array :
loads= [ 0.1::0.1::3]
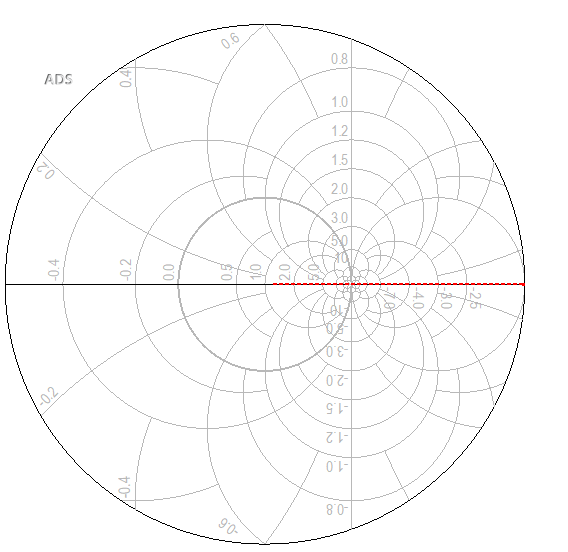
My desired chart which is presented in one of keysight's tutorials must be like :
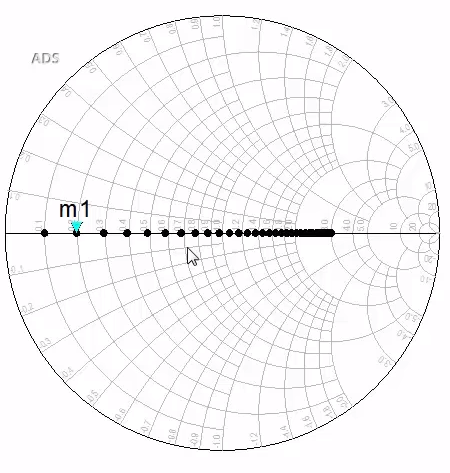
But I get this:
I know that I'm missing an important concept including normalizing and characteristic Impedance.
Thanks for your time!
Smith chart is a plane of reflection coefficient not impedance.
So you have to plot Gamma not Zload.
Zload=[0.1::0.1::3]
Gamma=(Zload-50)/(Zload+50)
I am not sure whether this helps you are not but I have plotted impedances in Matlab, which has RF toolbox.
I'm sure that are you are right. But still with this definition:
I don't understand what ADS is drawing? Is it drawing ref coeffs? so where did it get the characteristic impedance?
Thank you for your time
Simply any complex value.
Assume complex value, aho=boke+j*kasu.
Plot aho.
Plotted data is located at horizontal=boke and veritical=kasu.
That?s all.
What do you want to mean ?
I assumed your Zload is unnormalized, so I calculated Gamma with Rref=50.
If Zload is normalized, Gamma is (Zload-1)/(Zload+1).
Surely learn very basic things.
Unfortunately it is not simply drawing any complex value that we are introducing as input! try it once.
I've figured it out.
It is true that smith chart is the ref coefs ( reflection coefficients) and smith chart in ADS will assume any input value as ref coef AND " will draw the normalized Impedance that will result in the input ref coef ".
My mistake was that I expect it to draw the exact input value on the chart. I really was and am missing basic concepts.
Thank you for your time friend.
No.
It is Simply drawing.
You can not understand axises of smith chart at all.
Surely see and understand my first response.
Surely learn very basic thing.
Yes
You already have reflection factor and that is what ADS is drawing. The reference impedance information is not required for drawing. But yes, it is required to interpret the Smith chart if you want to read absolute impedance values.
Very Very Wrong.
ADS does not draw the normalized impedance.
Surely learn very basic things.
Rather ADS draws any complex value, aho simply.
Marker shows values, (1+aho)/(1-aho) from plotted any complex value, aho.
If you plot any complex value as reflection coefficient and place marker on it, marker calculates and shows impedance value from reflection coefficient.
That?s all.
Your misunderstandings resembles to the following.
https://www.edaboard.com/showthread.php?383512
what your said is exactly what I said !
you'r just naming normalized Impedance aho!
Surely you are yourself stuck with it a little. Every complex concept consist of very simple things.
It's correct what I just said. let's give it a try!
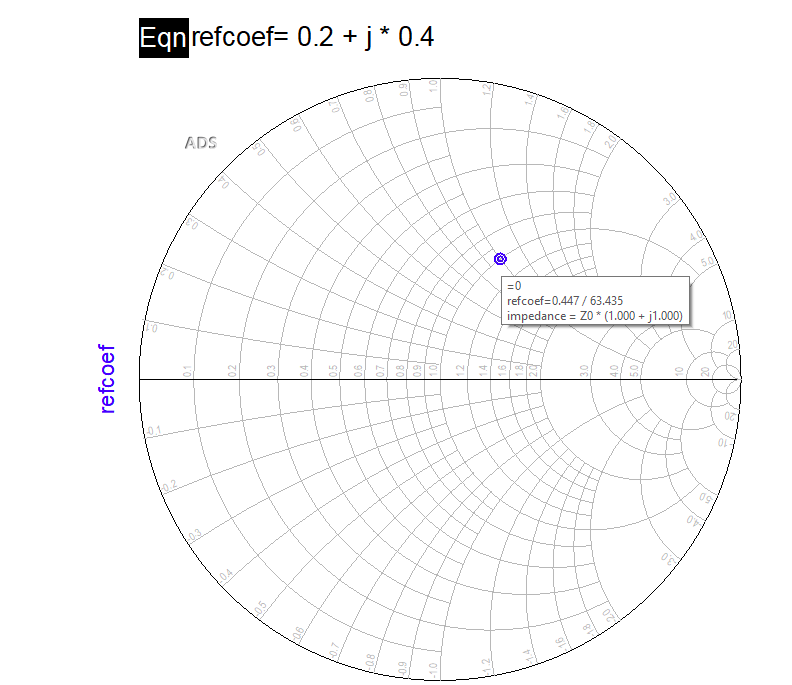
assume we have a Impedance: Z = 50 + j50
our characteristic Impedance is : Z0= 50
our normalized Impedance gonna be z= 1 + j
then we can have our ref coef = (z-1)/(z+1) = 0.2 + j 0.4
simply we give this to ADS and it shows us its corresponding normalized impedance.
I think you've just confused your self with your new names :)
Very Very Wrong.
It is reflection coefficient not impedance.
z=(1+Γ)/(1-Γ), Γ=(z-1)/(z+1)
ADS plot any complex value, aho(=Γ), marker calculates and shows z.
Simply you can not understand basic things including Smith chart correctly.
Plotted data is a reflection coefficient, Γ not impedance, z.
Surely learn very basic things.
Please Give it a try, And see. You are Wrong about what ADS is doing. I've Showed it exactly on the picture, Impedance is obviously visible on the chart, forget about the marker, I
TAKE A LOOK AT IT exactly! :) I've upload it with a better resolution
If you are not agree please show it on a ADS smith chart AND Not simply speaking and taking time. thanks!

Sweetheart, calm down. Every RF engineer can read normalized impedance from Smith Chart.
Right.
However ADS plot data is reflection coefficient not impedance.
Impedance value he sees is a result of marker calculation.
He thinks wrongly ADS plot impedance value directly.
Do you understand normalized impedance? When Smith chart is teached at universities, you learn about the normalized impedance/admittance grid on the chart. There is no need for "marker calculation", just properly read the Smith chart.
https://en.wikipedia.org/wiki/Smith_..._chart_gen.svg
Z= 50 + j50
Z0= 50
normalized Impedance (z)= 1+j1
Gamma = (z-1)/(z+1) = 0.2 + j0.4
LOOK!
It's Obvious that Smith chart is not drawing the complex input it self! So what is it drawing?! Reclection coefficient
? no! see :)

Such silly question is nonsense for me.
No.
Marker readout is necessary since grids are rough.
Can you read high impedance value exactly without marker readout ?
Surely learn difference between RF fundamentals and software implementation. The Smith chart is all about that background impedance grid - without that, it's just a polar plot of reflection factor.
Smith Chart is a Graphical Representation of Complex Quantities so every kind of Complex Quantities can be read such as Impedance,Admittance,Reflection Coefficients,s-parameters etc.
However this thread's issue is software implementation.
See attached figure.
Very fortunately it is simply drawing any complex value aho.
boke=(1+aho)/(1-aho)
Marker calculates and shows boke.
Horizontal axis corresponds to real(aho).
Vertical axis corresponds to imag(aho).
Full circles correspond to real(boke).
Partial circles correspond to imag(boke).
However ADS draws aho not boke.
ADS don't care whatever aho is.
If you identify aho as reflection coefficient Γ, boke is normalized impedance z.
Relation between aho and boke is bilinear transformation.
aho=(boke-1)/(boke+1), boke=(1+aho)/(1-aho)
Such relation is not limited to Γ and z.
Polarization chart also utilizes this relation.
https://www.edaboard.com/showthread.php?371150
Wrong.
ADS surely draws the exact input value on the chart simply.
I'm correct.
You are wrong.
Simply you can not understand both ADS and Smith Chart.
Wrong.
ADS simply draws the complex input it self.
Your misunderstandings resembles to the following.
https://www.edaboard.com/showthread.php?383512