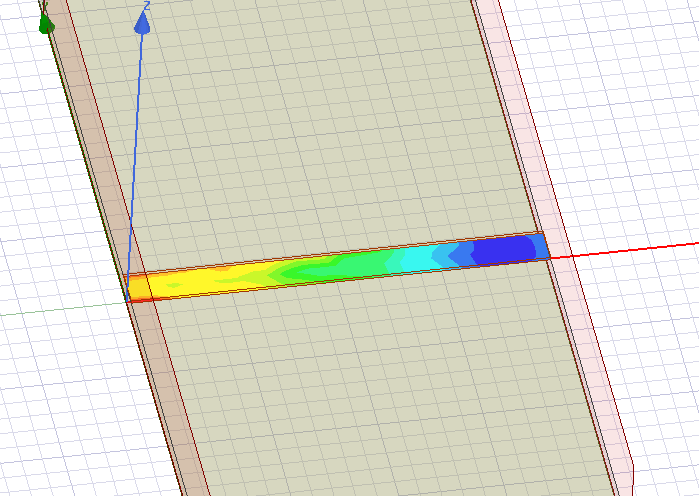
Plot field of microstrip
But the field is obvious un-even. At port1 it is yellow indicating intense field. At port2 it is deep blue indicating weak field. I can't reconcile it with the S21. I expect even distributed field from port1 to port2.
Can anyone enlighten me?
What value have you plotted? This looks like current density in an OPEN ended line.
I chose Quantity as Mag_E, and In Volume as Substrate. The distribution pattern changes if I change frequency value in Intrinsic Variable, so that I wonder it is like standing wave. But I am using wave port without Renormalization. So I think there shouldn't be reflection leading to standing wave.
Now I figured out why. Mag_E is real time amplitude at a specified phase, which means it will exhibit the waveform in the space. After using ComplexMag_E, the standing wave pattern disappears.
But it is not the ending. I changed the model to create standing wave by setting wave port impedance different from the microstrip. S21 exhibits clearly filter effect, but ComplexMag_E is still even level along the micro strip.
I am confused.