怎样使示波器的显示回到初始状态?
横轴的时间标量回到0值,就是回到初始状态阿
不知道该怎么做,哪位大虾告知,谢谢!
好像有cleargraph的属性
找找
画图的时候就先清 graph 的啊,deletgraph
首先用initiate array.vi 创建一个0维数组。
如果你用的是chart,在diagram里面右键点这个图标,create>>property node, Properties>>History data,再右键点这个property node, change to write,然后把你创建的0维数组连到这个property node上即可。
如果你用graph 显示波形,则要在diagram里面右键点这个图标,create>>Local variabel,然后把创建的0维数组连给这个上Local variabel。
另外,我不喜欢你的日文签名档。
怎么我创建的0维数组和你说的History data连接不上去啊
How?
see the attachment.
用的是chart,无法将数组连到property node,
示波器显示的是4路数据,应该怎么办啊?
Then make Initialize Array.vi 2-D. Hopefully you know how to debug in LV.
follow your advice, i meet new problem. how to solve it?
pls see my attachment. 3ks.
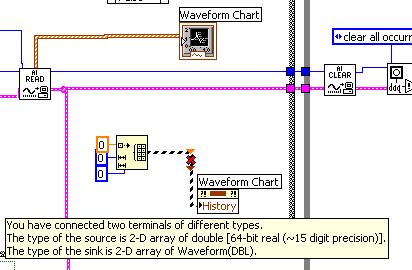
I see what the problem is. Since you connect the waveform outout from the AI Read.vi to the chart, the data format of the chart is thus "waveform". You need Build Waveform.vi with the 2-D empty matrix as "y".
Suggestion: Everytime when you have such data format mismatch problem, click the brken arrow under the main manu, you can see what the problem is and how to solve it easily. Wish this would help you to learn how to use LV. Actually it is good to learn dubug first.
HOW TO REALIZE THIS STEP?
"You need Build Waveform.vi with the 2-D empty matrix as "y". "
type conflict.
check the input data type (out from "AI Read" vi, seems to be a cluster),
then initialize a array with a element of the same type.
also check your number of plots and the empty array size.
Sorry, that was my mistake. Build Waveform.vi cannot take 2-D input. Then we should build the 2-D waveform afterwards. See the attachment.

搞定了,
many thanks