Spectre如何正确的仿真SNAD?
1. 在有限采样点数情况下,旁瓣是无法避免的,这样计算结果就会使distortion高于实际值2. 加了窗函数后会出现非常高的2,3次谐波
没有找到什么地方有详细的说明文档
I don't have chinese input tools, so please allow me to use Englisch to write my commends.
MATLAB FFT simulation is realiable!
1. I don't understand what you mean of the side lobe, maybe you mean the beam width
2. adding a window itself will not introduce any harmonics, if you are using the right window
3. if would be much more easier for us to help to debug if you can upload at some plots and explain a little bit of your circuit and measuring method
Hi quantus,我遇到的问题是这样的,我用cadence自带的ideal_ADC来量化了一个sine信号,
ADC输出再通过一个理想的DAC后再采样128个点(刚好一个sine周期)
我把采样的128个点输入到matlab后得到下面的波形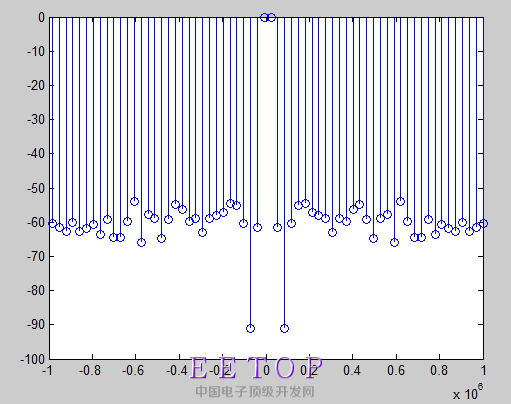
我计算SNAD后发现8b的ADC的ENOB只有7.03
不知道什么地方丢掉的
SNAD就是用主频的除以所有其他频率信号功率
我加入hamming window以后,得到下面的FFT结果
这个结果跟cadence calculator fft结果很一致

可以看到出现很高的2次谐波
1. use cohrent sampling
2. try to plot single-sided spectrum rather than a two-sided one
3. specify your input frequency, so that I know the frequency of the second harmonic
4. for such idea adc, an ENOB of 7.98 can be obtained
5. plot the spectrum directly, don't use the stem fucntion